|
|---|
 |
 |
|---|---|
Construct a pendulum that is 1 meter long and measure its period using a phone clock. Plot the period as a function of oscillation angle.
The analytic result for the period of a pendulum is
Pendulum length  =  L  =  1 meter
Gravity          =  g  =  9.8 m/s2
Period           =  T  =  2 π (L/g)1/2  =  2.006 seconds
This formula is exact in the limit of small oscillation angle and the period increases for larger oscillation angles.
Construct a plot of the pendulum period as a function of length.
Era             Method for measuring speed

Renaissance     Use a pendulum clock to measure time and a ruler to measure distance
20th century    Use a pocket watch or phone clock to measure time and a ruler to measure distance
21st century    Film the object and analyze the video frame-by-frame
Roll a billiard ball across a table and measure its speed using all three of the above methods. What would you estimate is the error of each method?
Velocity  =  V
Time      =  T
Position  =  X  =  V T
By viewing a video frame-by-frame you can measure the position and time of the ball for a set of different times. For example,
 Time   Position
 (s)      (m)

  .0      .10
  .5      .21
 1.0      .32
 1.5      .43
 2.0      .54
 2.5      .65
 3.0      .76
The velocity at Time=.75 can be approximated as:
Time of first measurement      =  T1  =  .5
Time of second measurement     =  T2  = 1.0
Position at first measurement  =  X1  =  .21
Position at second measurement =  X2  =  .32
Time difference                =  T  =  T2 - T1  =  1.0 - .5  =  .5
Position difference            =  X  =  X2 - X1  =  .32 - .21 =  .11
Velocity at Time=.25           =  V  =  X  / T   =  .22 meters/second
If an object starts from rest at X=0 and undergoes constant acceleration then after a time T,
Time         =  T
Acceleration =  A
Velocity     =  V  =  A T
Position     =  X  =  .5 A T2  =  V2 / (2 A)
Acceleration is a change in velocity over a change in time.
Record a video of a ball dropping and measure the height and time to reach the floor. Calculate the gravitational acceleraton.
A = 2 X / T2
 |
|---|
Roll two balls toward each other so that they collide head-on and rebound in the opposite direction from which they came.
Blue ball:  Initially on the left and moving toward the right
Red ball:   Initially on the right and moving toward the left
Mass     =  Mass of the ball in kg
Velocity =  Velocity of the ball in meters/second
Momentum =  Momentum of the ball in kg meters/second
         =  Mass * Velocity
Energy   =  Kinetic energy of the ball in kg meters2/second2
Measure the mass, velocity, momentum, and energy of the balls before and after
the collision.
Total momentum  =  Momentum of the blue ball  +  Momentum of the red ball
Total energy    =  Energy of the blue ball    +  Energy of the red ball
Calculate the total momentum and energy before and after the collision, and also calculate
Energy ratio = Total energy after the collision / Total energy before the collisionMomentum is conserved in collisions and usually some energy is lost to heat.
 |
 |
|---|---|
Drop a ball from rest and measure the height of the first bounce.
Bounce ratio = Height of first bounce / Initial heightPlot the bounce ratio as a function of height.
 |
|---|
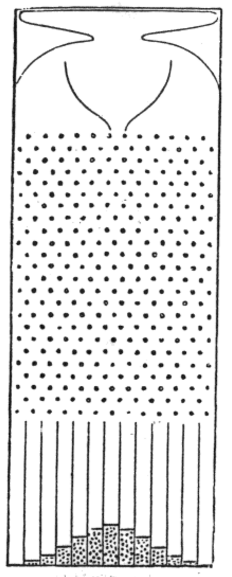
Construct a pendulum, using as large a length and mass as possible. Because of the Earth's rotation the pendulum will precess like the Foucault pendulum above, although the precession is exaggerated in the animation. In reality the precession is slower.
Start the pendulum and observe its direction and then observe the direction one hour later.
Q  =  Rate of change of the direction angle of a pendulum
   =  360 * sin(Latitude)        degrees/day
   =  360 * sin(40.667 degrees)  degrees/day                 For New York City
   =  234.6                      degrees/day
   =    9.78                     degrees/hour

New York City Latitude   =  40.667 degrees North
New York City Longitude  =  73.933 degrees West
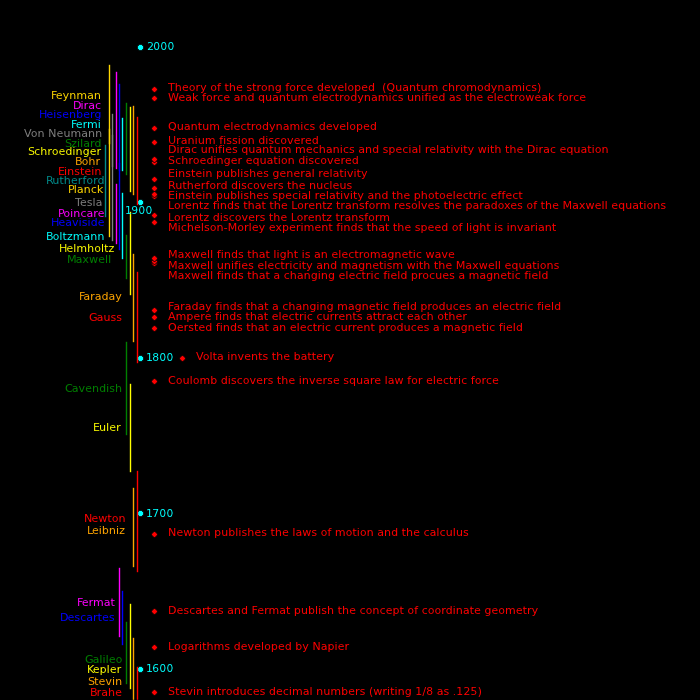
 100  Zhang Heng constructs a seismometer using pendulums that was capable of
      detecting the direction of the Earthquake.
1500  Pendulums are used for power, for machines such as saws, bellows, and pumps.
1582  Galileo finds that the period of a pendulum is independent of mass
      and oscillation angle, if the angle is small.
1636  Mersenne and Descartes find that the pendulum was not quite isochronous.
        Its period increased somewhat with its amplitude.
1656  Huygens builds the first pendulum clock, delivering a precision of
      15 seconds per day.  Previous devices had a precision of 15 minutes per day.
1658  Huygens publishes the result that pendulum rods expand when heated.
      This was the principal error in pendulum clocks.
1670  Previous to 1670 the verge escapement was used, which requires a large angle.
      The anchor escapement mechanism is developed in 1670, which allows for a smaller
      angle.  This increased the precision because the oscillation period is
      independent of angle for small angles.
1673  Huygens publishes a treatise on pendulums.
1721  Methods are developed for compensating for thermal expansion error.
1726  Gridiron pendulum developed, improving precision to 1 second per day.
1851  Foucault shows that a pendulum can be used to measure the rotation period of
      the Earth.  The penulum swings in a fixed frame and the Earth rotates with
      respect to this frame.  In the Earth frame the pendulum appears to precess.
1921  Quartz electronic oscillator developed
1927  First quartz clocks developed, which were more precise than pendulum clocks.
 |
|---|
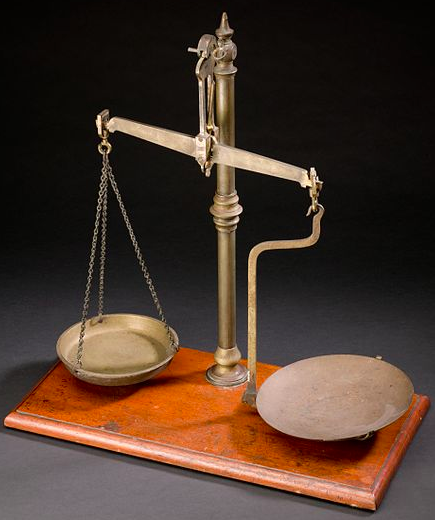
Construct a balance scale using any materials that would have been available to Newton.
Collect a set of identical coins to use as standard masses. Dimes are ideal because they have the smallest mass.
Measure the mass of one of the balls from the list below in units of coin masses and then use the table of coins to convert it to kg. What is the relative error?
Suppose there are N coins on the left side of the balance and N+1 coins on the right, with all coins being identical. If N is small then the scale can tell the difference and if N is large it can't. What is the largest value of N for which you can tell the difference between N coins and N+1 coins?
We can define a "resolution" for the scale as 1/N. For example, if a scale has a maximum mass of 1 kg and it can resolve down to 1 gram, then its resolution is .001 kg / 1 kg = 0.001.
Using a ruler, measure the volume of a nickel and compare it to the data below.
 |
 |
 |
 |
 |
 |
|---|---|---|---|---|---|
 |
 |
 |
 |
 |
 |
 |
|---|
             Mass   Diameter  Thickness  Copper  Nickel  Zinc  Manganese
             (g)      (mm)      (mm)
Dime         2.268   17.91      1.35     .9167    .0833
Penny        2.5     19.05      1.52     .025            .975         Copper plated
Nickel       5.000   21.21      1.95     .75      .25
Quarter      5.670   24.26      1.75     .9167    .0833
1/2 dollar  11.340   30.61      2.15     .9167    .0833
Dollar       8.100   26.5       2.00     .885     .02    .06   .035   Plated with manganese brass
Dollar bill  1.0    155.956      .11                                  Height = 66.294 mm
 |
|---|
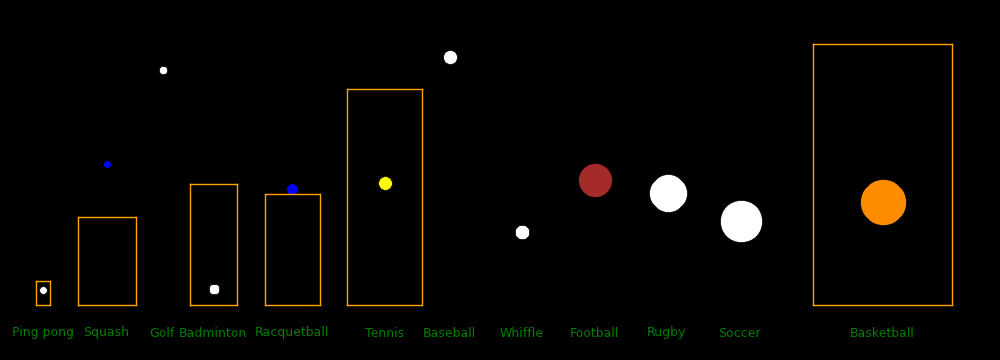
The distance from the back of the court to the ball is the characteristic distance the ball travels before losing half its speed to air drag.
             Ball    Ball   Court   Court    Ball
           diameter  Mass   length  width   density
             (mm)    (g)     (m)     (m)    (g/cm3)

Ping pong      40      2.7    2.74    1.525   .081
Squash         40     24      9.75    6.4     .716
Golf           43     46                     1.10
Badminton      54      5.1   13.4     5.18    .062
Racquetball    57     40     12.22    6.10    .413
Billiards      59    163      2.84    1.42   1.52
Tennis         67     58     23.77    8.23    .368
Baseball       74.5  146                      .675   Pitcher-batter distance = 19.4 m
Whiffle        76     45                      .196
Football      178    420     91.44   48.76    .142
Rugby         191    435    100      70       .119
Bowling       217   7260     18.29    1.05   1.36
Soccer        220    432    105      68       .078
Basketball    239    624     28      15       .087
Cannonball    220  14000                     7.9     For an iron cannonball
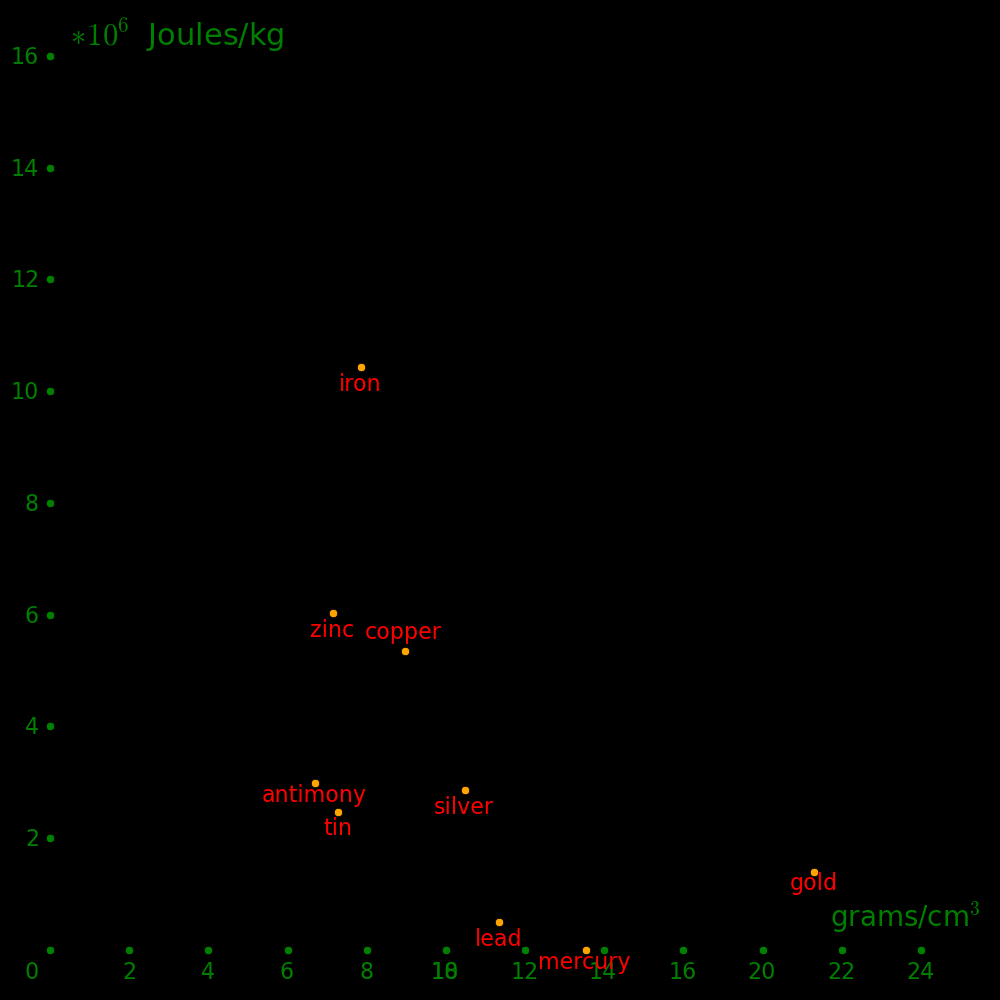
In ancient times, gold was an ideal currency because it was hard to counterfeit. No other element known had a density that was nearly as large.
Silver can be counterfeited because lead is more dense and cheaper.
The metals known to ancient civilizations were:
         Density
         (g/cm3)

Tin        7.3
Iron       7.9
Copper     9.0
Bismuth    9.8
Silver    10.5
Lead      11.3
Mercury   13.5
Gold      19.3
Lead      11.3
Gold can be counterfeited to a limited degree because mass and volume were difficult
to measure in ancient times. One could shave off a small amount of gold from a coin,
small enough so that the change in volume is undetectable.
Newton was Master of the Mint he and placed the United Kingdom on the gold standard. He was the Sherlock Holmes of his era and he caught all the counterfeiters.
        Earliest   Shear    Melt  Density
        known use  Strength (K)   (g/cm3)
        (year)     (GPa)
Wood    < -10000     15        -    .9
Rock    < -10000
Carbon  < -10000
Diamond < -10000    534     3800   3.5
Gold    < -10000     27     1337  19.3
Silver  < -10000     30     1235  10.5
Sulfur  < -10000
Copper     -9000     48     1358   9.0
Lead       -6400      6      601  11.3
Brass      -5000    ~40                    Copper + Zinc
Bronze     -3500    ~40                    Copper + Tin
Tin        -3000     18      505   7.3
Antimony   -3000     20      904   6.7
Mercury    -2000      0      234  13.5
Iron       -1200     82     1811   7.9
Arsenic     1649      8     1090   5.7
Cobalt      1735     75     1768   8.9     First metal discovered since iron
Platinum    1735     61     2041  21.4
Zinc        1746     43      693   7.2
Tungsten    1783    161     3695  19.2
Chromium    1798    115     2180   7.2


Stone age    Antiquity
Copper age    -9000
Bronze age    -3500
Iron age      -1200
Bronze holds an edge better than copper and it is more corrosion resistant.
Gold was the densest known element until the discovery of platinum in 1735. This made it impossible to counterfeit as a currency.
 |
|---|
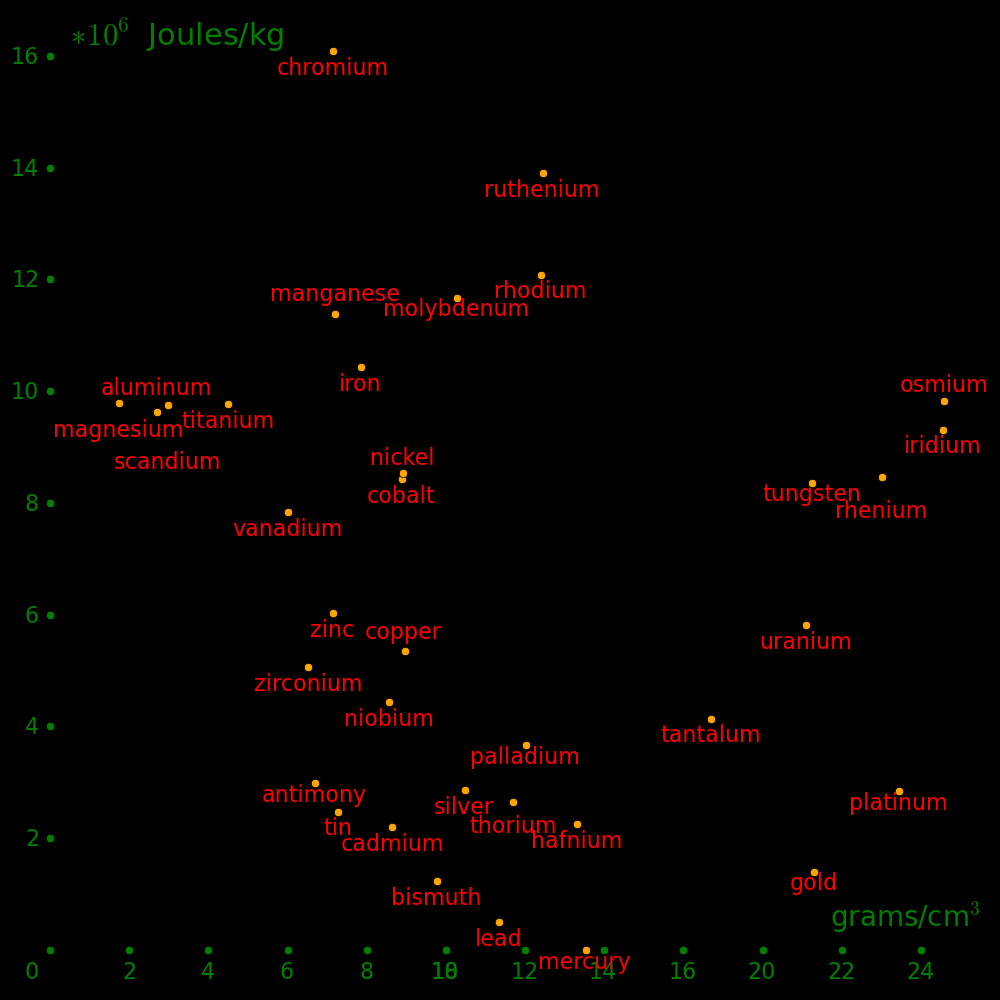
Horizontal axis:  Density
Vertical axis:    Shear modulus / Density       (Strength-to-weight ratio)
 |
|---|
Horizontal axis:  Density
Vertical axis:    Shear moduus / Density       (Strength-to-weight ratio)
Beryllium is beyond the top of the plot.
Metals with a strength-to-weight ratio less than lead are not included, except for mercury.
 |
|---|
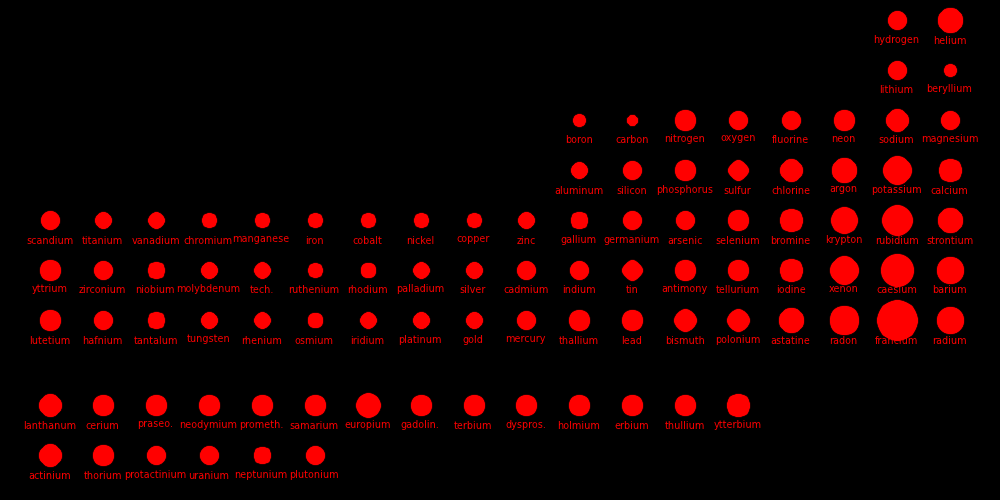
Dot size  =  Atomic radius
          =  (AtomicMass / Density)1/3
For gases, the density at boiling point is used.
Suppose you climb a set of stairs.
Height  =  Height of a set of stairs
Mass    =  Mass of a person
Gravity =  9.8 m/s2
Energy  =  Mass * Gravity * Height
Time    =  Time required to climb the stairs
Power   =  Energy / Time
        =  Mass * Gravity * Height / Time
        =  Mass * Gravity * Vertical velocity
Agility =  Power / Mass
Climb 3 flights of stairs and measure the above quantities.
If a 100 kg person eats 3000 Calories in one day then
Energy  =  3000 Calories * 4.2e3 Joules/Calorie
        =  12.6 MJoules
Power   =  Energy / Time
        =  12.6e6 Joules / 1 Day
        =  12.6e6 Joules / 86400 seconds
        =  146 Watts or Joules/second
Agility =  Power / Mass
        =  1.46 Watts/kg
 |
|---|
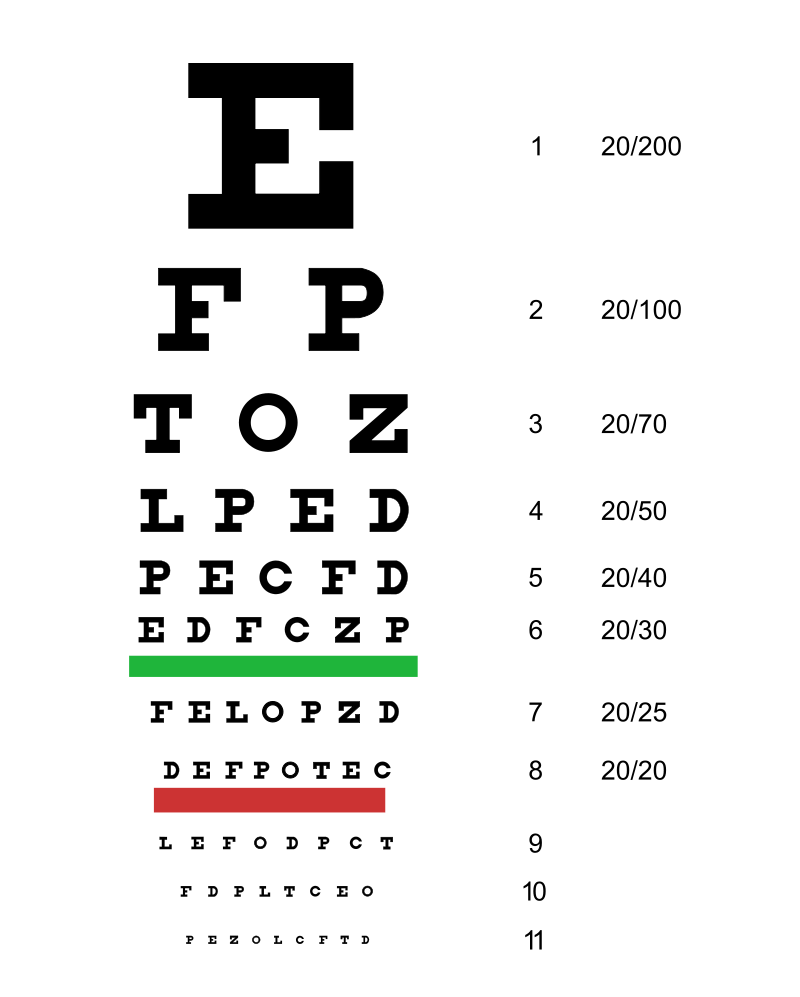
A person with 20/20 vision can distinguish parallel lines that are spaced by an angle of .0003 radians, about 3 times the diffraction limit. Text can be resolved down to an angle of .0015 radians.
        Resolution     Resolution    Diopters
        for parallel   for letters   (meters-1)
        lines          (radians)
        (radians)
20/20     .0003         .0015          0
20/40     .0006         .0030         -1
20/80     .0012         .0060         -2
20/150    .0022         .011          -3
20/300    .0045         .025          -4
20/400    .0060         .030          -5
20/500    .0075         .038          -6
"Diopters" is a measure of the lens required to correct vision to 20/20.
The closest distance your eyes can comfortably focus is 20 cm. If a computer screen is this distance away then the minimum resolvable pixel size is
Pixel size  =  Angle * Distance
            =  .0003 * .2
            =  .00006 meters  =  .06 mm
For a screen that is 10 cm tall this corresponds to 1670 pixels.
Try measuring your visual resolution for parallel lines and text.
All waves diffract, including sound and light. Light passing through your pupil is diffracted and this sets the limit of the resolution of the eye.
D = Diameter of a human pupil = .005 meters W = Wavelength of green light = 5.5*10 meters A = Characteristic diffraction angle (radians) = 1.22 * W/D for a circular aperture = .00013
 |
 |
|---|---|
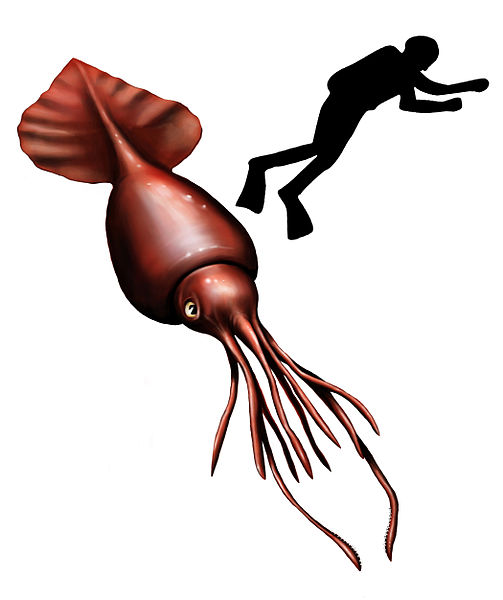
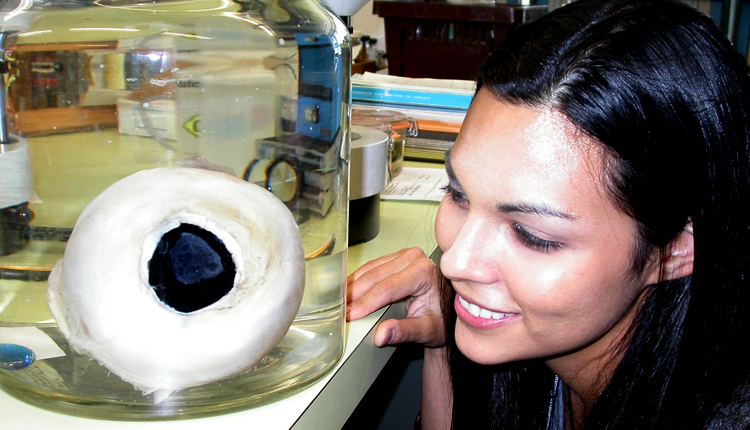
The colossal squid is up to 14 meters long, has eyes up to 27 cm in diameter, and inhabits the ocean at depths of up to 2 km.
Let (X,Y) be a point on a circle of radius R.
θ   =  Angle of the point (X,Y) in radians
X   =  R cos(θ)
Y   =  R sin(θ)
Y/X =    tan(θ)
If θ is close to zero then
X ~ R
Y << X
Y << R
sin(θ) ~ θ
tan(θ) ~ θ
The "small angle approximation" is
Y/X ~ θ
Measure your visual resolution angle for the following situations:
Resolving pairs of dots
Resolving parallel lines
Resolving Letters
Resolving pixels on a phone
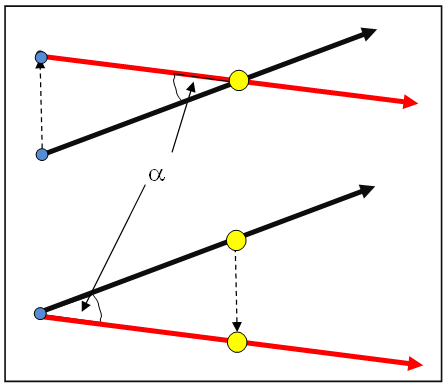
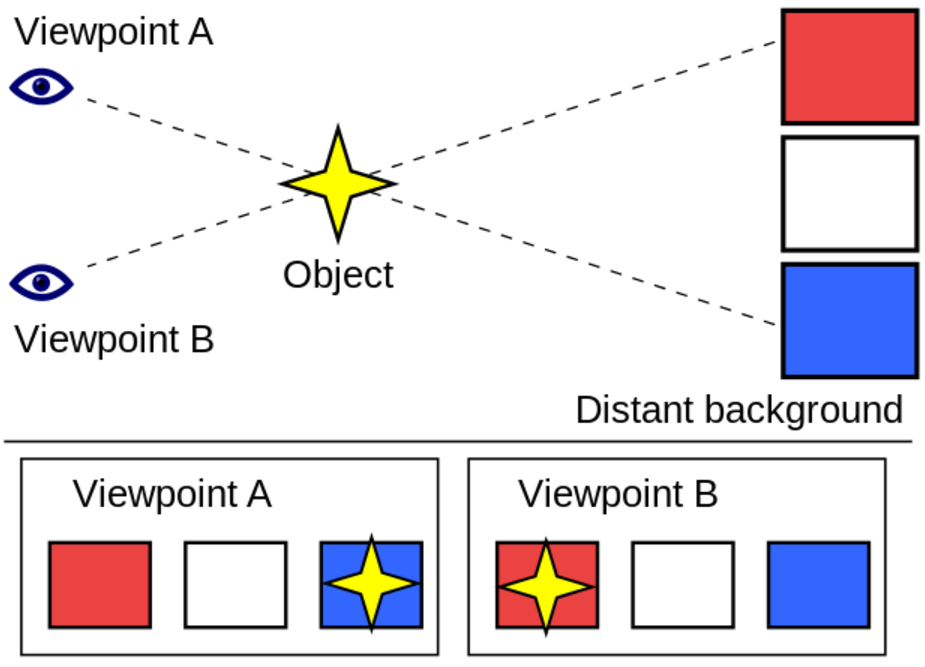
There are two ways of measuring parallax: "without background" and "with background". The presence of a background improves the precision that is possible.
Without background:
 |
 |
 |
|---|---|---|
With background:
 |
 |
 |
|---|---|---|
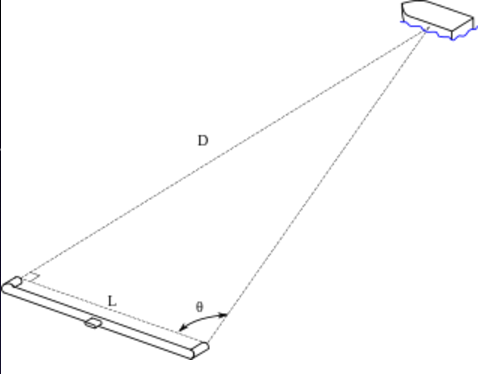
Place two observer marks on the floor around 1 meter apart and place a target mark on the other side of the room.
X1  =  Observer mark #1
X2  =  Observer mark #2
X0  =  Target mark
X   =  Distance between the observer marks  =  |X2 - X1|
D   =  Distance from observer mark #1 and the target mark  =  |X0 - X1|
 |
 |
|---|---|
Use the Pythagorean triple {3,4,5} to create a right angle and arrange the marks so that the angle with the vertex at X1 is a right angle. In other words, X and D should be perpendicular to each other.
Use a ruler to measure X and D.
Use a protractor to measure the angle with the vertex at X2.
θ = Difference between a right angle and the angle with vertex at X2.Using the small angle approximation,
θ = X / DCalculate D using the measured values for X and θ.
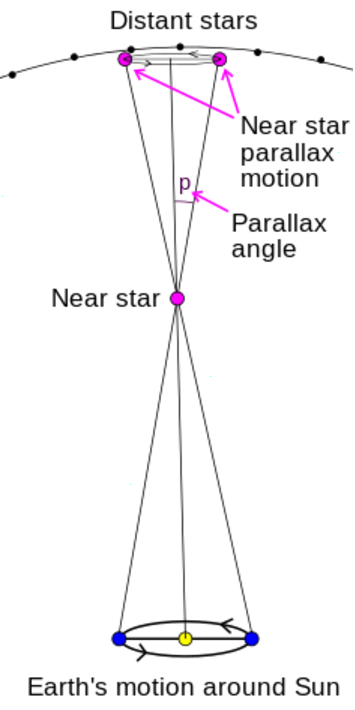
Look out the lab window and find two buildings that are both in the same direction. One building should be much farther away than the other. Use Google Maps to find the distances to the buildings.
The near building is the target for which we will measure the distance, and the far building is the background that allows us to measure precise angles.
Select two vantage points from inside the lab that are as far apart as possible and that can both see the buildings, and measure the distance between them. Measure the difference in the angle that the two vantages perceive of the near building, and calculate the distance to the near building.
 |
|---|
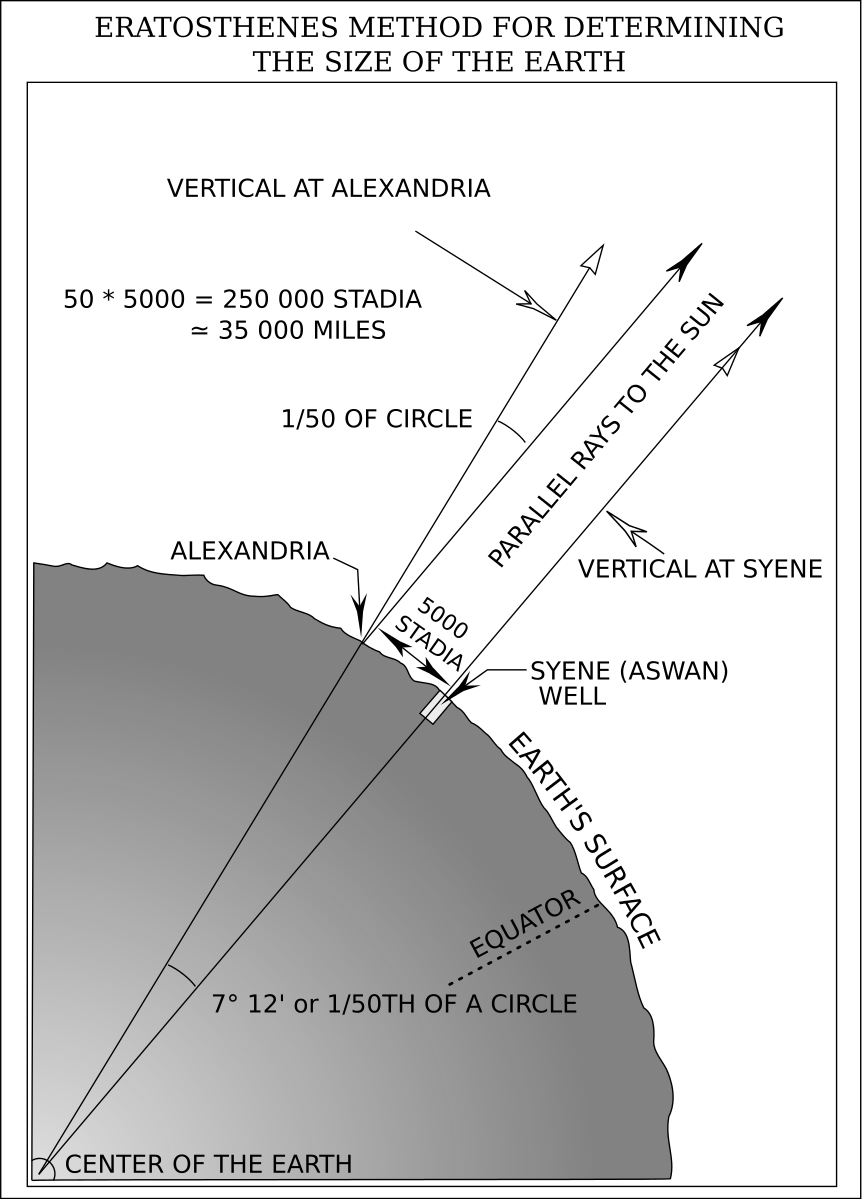
Eratosthenes produced a measurement of the Earth that was accurate to 2 percent.
 |
 |
|---|---|
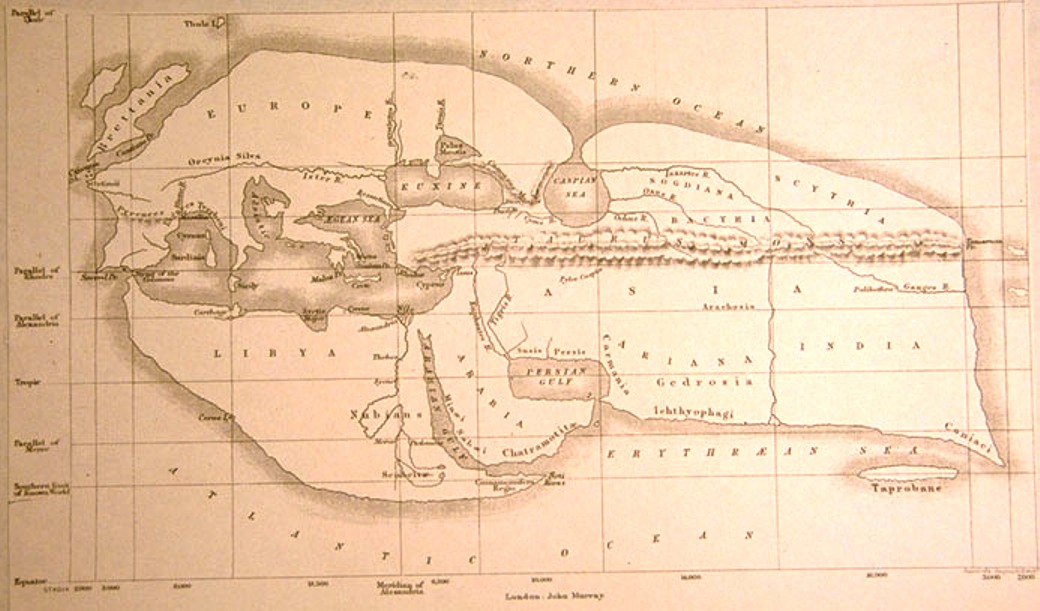
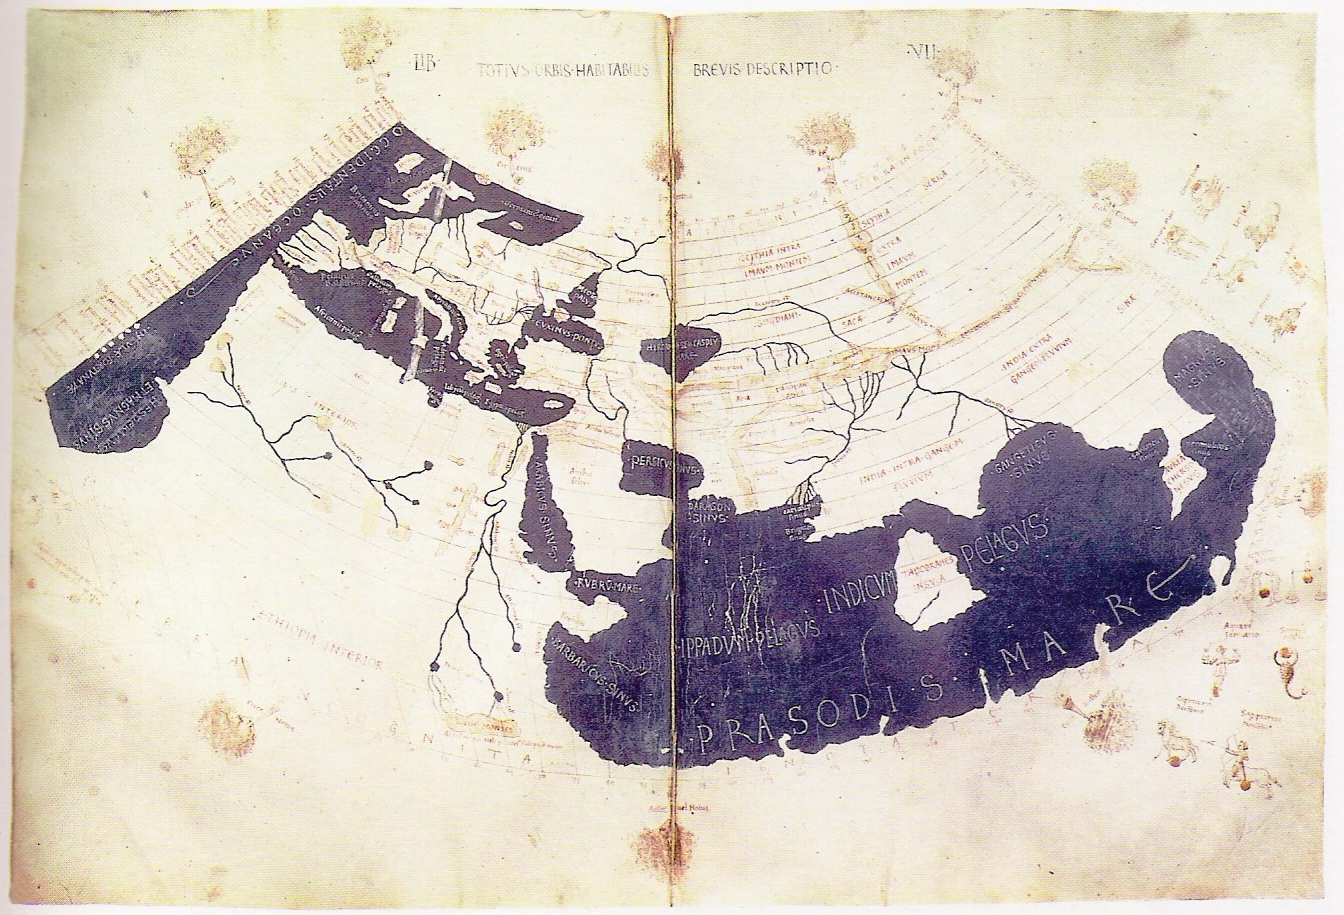
Ptolemy developed a system of latitude and longitude for mapping the world. His map covered 1/4 of the globe and was the standard until the Renaissance.
Find a long pole and use it to measure the angle of the sun with respect to due south. Use a pendulum bob to ensure that the pole is precisely vertical. At the same time, have an accomplice at a different latitude perform the same measurement. Use Google maps to determine the distance between you and your accomplice in the North-South direction, and use the measurements to calculate the radius of the Earth.
The radius of the Earth is
θ1 =  Angle of the shadow measured in New York City in degrees
θ2 =  Angle of the shadow measured by the accomplice
X  =  Distance between you and your accomplice in the latitude direction
   =  EarthRadius * |θ1-θ2| π / 180        (meters)

New York City Latitude   =  40.667 degrees North
New York City Longitude  =  73.933 degrees West
Earth radius             =    6371 km
 |
 |
 |
|---|---|---|
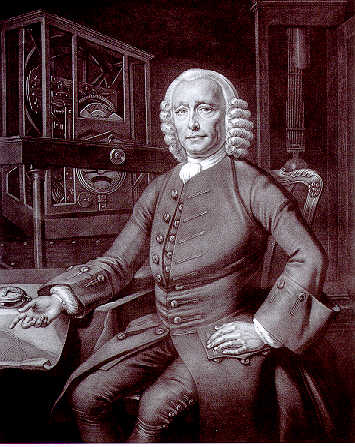
In 1714, the British Parliament established the "Longitude Prize" for anyone who could find an accurate method for determing longitude at sea.
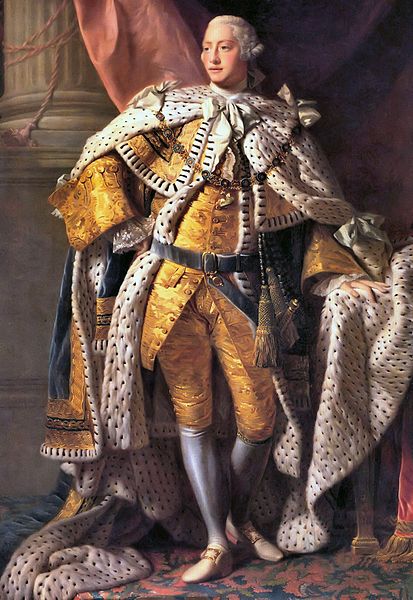
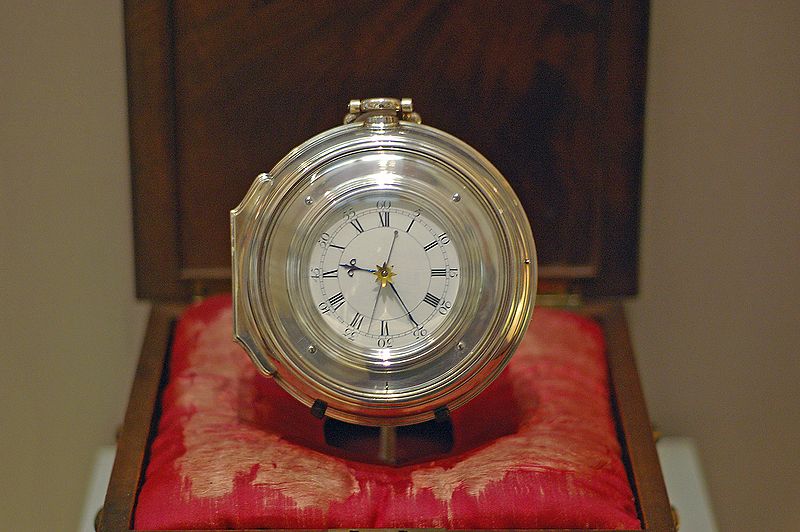
John Harrison solved the problem by developing precise clocks but Parliament refused to pay out. In 1772, Harrison gave one of his clocks to King George III who personally tested it and found it to be accurate to 1/3 of one second per day. King George III advised Harrison to petition Parliament for the full prize after threatening to appear in person to dress them down.
Maskelyne was the chairman of the board responsible for awarding the Longitude prize and he refused to award it to Harrison. Maskelyne developed the "Lunar distance method" for determing longitude, which was decisively defeated by Harrison's clocks in a test at Barbados. Also, James Cook abandoned the lunar distance method after his first world voyage and used Harrison's clocks for his 2nd and 3rd voyages.
From Wikipedia: "Cook's log is full of praise for the watch and the charts of the southern Pacific Ocean he made with its use were remarkably accurate."
Maskelyne held the post of "Astronomer Royal" and was hence in charge of awarding the Longitude Prize. He opposed awarding it to Harrison and Harrison was instead paid for his chronometers by an act of parliament.
 |
 |
 |
|---|---|---|
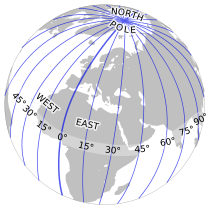
Measure the time of sunset and also have an accomplice at a different longitude do the same measurement. Use the measurements to calculate the difference in longitude and use Google maps to find the exact value.
T1  =  Time that you measure for sunset in hours
T2  =  Time that your accomplice measures for sunset in hours
L1  =  Your longitude in degrees
L2  =  Your accomplice's longitude in degrees

15 * (T1 - T2)  =  L1 - L2
 |
|---|
 |
 |
|---|---|
 |
 |
|---|---|
 |
|---|
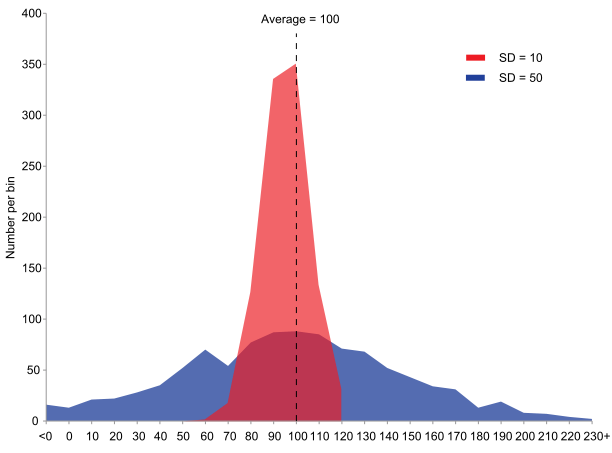
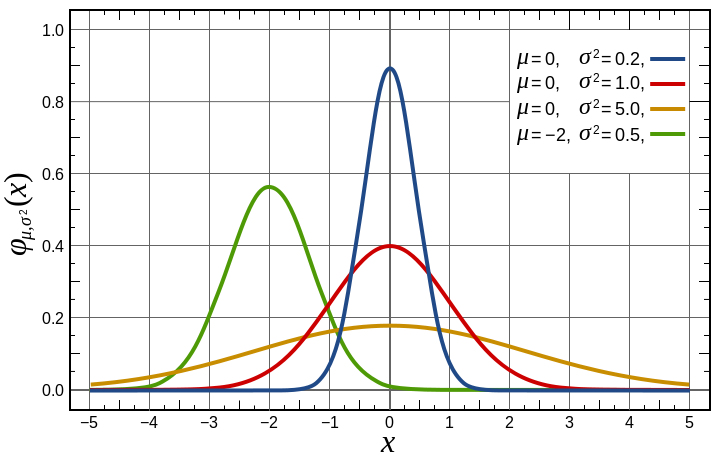
Suppose you have a set of measurements X_j, for example:
j      Length (meters)

1         1.232
2         1.251
3         1.256
4         1.245
5         1.233
6         1.238
7         1.433
The numbers cluster around the value "1.24" except for measurement #7 "1.433", which is an "outlier". Generally the outliers are removed and the error is computed from the well-baheaved numbers. Usually the outliers are measurement errors, although on occasion it can turn out that the outlier is the correct measurement and the seemingly well-bahaved numbers are in error. There is no general rule for this. One has to be careful to ensure that the measurement is measuring what you think it is measuring.
Let "N" be the number of measurements.
If we exclude the outlier then the mean is
Mean  =  N-1 * ∑j Xj  = (1/6)  *  (1.232 + 1.251 + 1.256 + 1.245 + 1.233 + 1.238)
      =  1.242
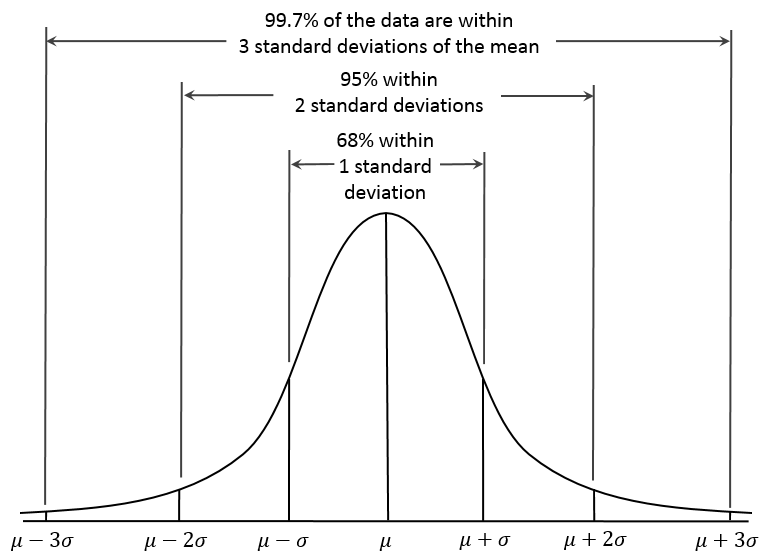
The "Gaussian error" is defined as
Error2   =  N-1 * ∑j (Xj - Mean)2
         =  6-1  * [  (1.232-1.242)2 + (1.251-1.242)2 + (1.256-1.242)2
                     + (1.245-1.242)2 + (1.233-1.242)2 + (1.238-1.242)2 ]
         =  .0090
If we were to include the outlier then it would dominate the calculation, rendering the other measurements
meaningless.
The measurement is quoted as
Measured value  =  Mean  +-  Error
                =  1.242 +-  .0090
Suppose the length of an object is measured several times, with the results in meters being:
X1  =  2.553
X2  =  2.534
X3  =  2.536
X4  =  2.563
X5  =  2.541
X6  =  2.544
X7  =  2.560
X8  =  2.539
What is the mean of the data and what is the Gaussian error? Plot the data to show how it is distributed.
For a battery,
Energy  =  Energy contained in the battery in Joules.
Mass    =  Mass of the battery
Volume  =  Volume of the battery
Time    =  Time required for the battery to go from full to empty
Power   =  Power consumed by the device in Watts or Joules/second
        =  Energy / Time
Area    =  Surface area of the screen
Flux    =  Power / Area

Energy density  =  Energy / Volume
Energy per mass =  Energy / Mass
Power per area  =  Power  / Area
Battery energies are often quoted in Watt*hours or Amp*hours.
For a Lithium battery,
Voltage =  Battery voltage  =  3.7 Volts
Current =  Electric current being supplied by the battery (Amperes)
Power   =  Power being supplied by the battery  (Watts)
        =  Current * Voltage

1 Watt*hour =  Energy associated with a power of 1 Watt for a duration of 1 hour
            =  Power           *  Time
            =  1 Watt          *  3600 Seconds
            =  1 Joule/second  *  3600 seconds
            =  3600 Joules
1 Amp*hour  =  Energy associated with a current of 1 Ampere for a duration of 1 hour
            =  Power                *  Time
            =  Current  * Voltage   *  Time
            =  1 Ampere * 3.7 Volts *  3600 Seconds
            =  13320 Joules
For example,
20 Watt*hours = 5.4 Amp*hours = 72000 Joules
For a phone or tablet battery, measure the energy, mass, volume, energy/volume, screen size, and the time the battery lasts while playing a graphics-intensive game.
Calculate the power being delivered by the battery, and also the power per screen area.
Data for batteries from Amazon.com.
                   Energy   Energy  Length  Width  Height   Energy  Energy   $   Energy/$
                   density   (MJ)    (m)     (m)    (m)      (Wh)    (Ah)         (kJ/$)
                  (MJ/m3)
Anker Astro E3      900      .137   136.9    67.3   16.5     10        2.7   22    6.2
Poweradd Pilot Pro  680      .426   185.4   121.9   27.9    118.4     32    130    3.3
Ravpower 23000      650      .306   185     124.5   20.3     85.1     23    100    3.1

1 kJ  =  103 Joules
1 MJ  =  106 Joules
Force can be measured using mass and gravity.
Mass    =  Mass of an object in kg
Gravity =  Gravitational acceleration at the Earth's surface
        =  9.8 meters/second2
Force   =  Gravitational force on the object in Newtons
        =  Mass * Acceleration
        =  Mass * Gravity
 |
 |
|---|---|
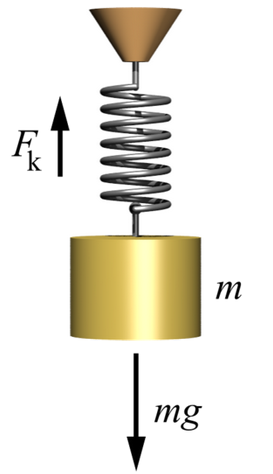
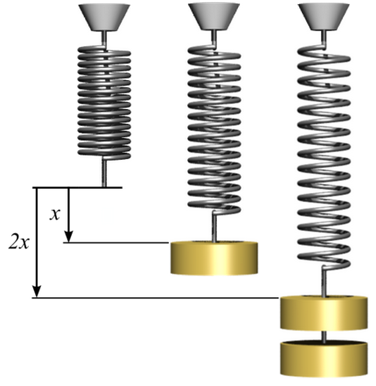
x     =  Distance that a wire stretches when a spring is applied.
K     =  Spring constant
Force =  Force on the spring
      =  K x      (Hooke's law)
Using any string or rope available, construct a plot of Force as a function of x,
all the way up to the breaking point.
In the region of low x, what is the value of K?
 |
|---|
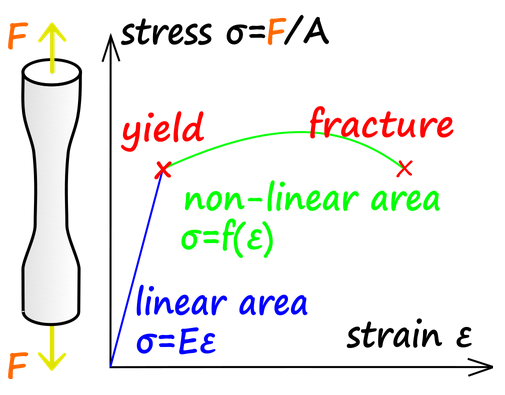
The stiffness of a wire depends on its intrinsic stiffness and on its cross sectional
area.
The tensile modulus characterizes the stiffness of a wire and it is proportional
to the spring constant.
For a wire,
For a wire, measure the following:
If a 100 kg person hangs from the wire, what is the minimum wire diameter for the wire
to not break?
The modulus and breaking strain can be measured by bending a beam.
If a force is applied to the center of a beam then it bends into a circular shape.
Measure the following:
Conduct measurements for several sled masses and measure the friction force for each mass.
Use this data to estimate the friction coefficient "Q" for the sled.
Conduct a set of experiments where the sled mass is constant and the surface area of contact
is varied. What is the result?
The friction coefficient depends on the types of surfaces used.
Try experiments with different kinds of surfaces and measure the coefficient of friction.
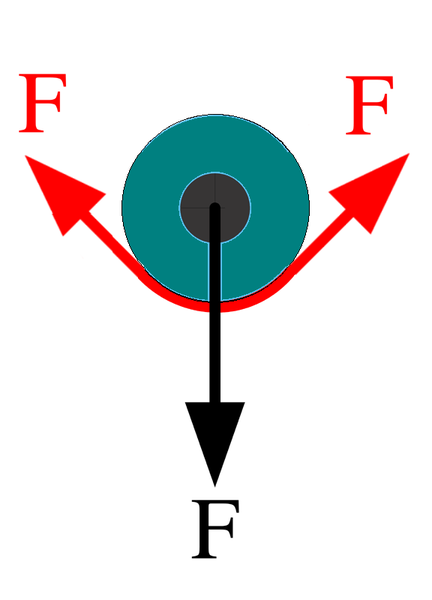
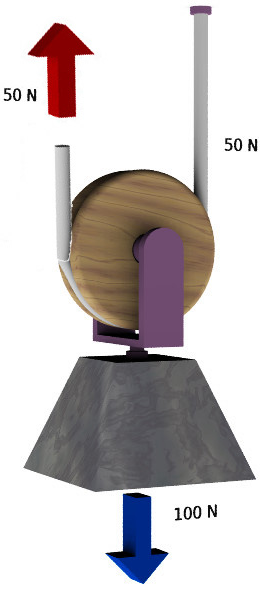
A pulley allows one to change the direction of a force.
This lab uses the
My Solar System simulaton at phet.colorado.edu.
Set up a simulation with the following parameters.
What is the minimum value of V for the planet to escape the star? What does the formula below
predict for V?
If the planet velocity is changed from the Y direction to the X direction, what is
the minimum value of V for the planet to escape?
If V is small then the orbit is highly elliptical, like a comet.
What is the value of V for a circular orbit if the planet's X position is changed
to either 25, 50, or 200? What does the formula below predict for V?
If two planets are too close together then they will interfere gravitationally.
Using the simulator, set up a system with 2 planets.
Run the simulation for values of x ranging from 100 to 150 and describe the results.
You can travel between planets with a "Hohmann maneuver". You start from the inner circular orbit,
fire the rocket, cruise on an elliptical "transfer orbit" the outer orbit, and then fire the rocket again to
put the rocket into the outer circular orbit.
The Earth and Mars system can be simulated using the following values.
Both the Earth and Mars are on circular orbits.
In the simulation, increase the Earth's "Y" velocity until you find the value that causes
the Earth to graze Mars' orbit. What is this velocity?
Discussion of the Hohmann maneuver
A planet "Tatooine" can be added halfway between the Venus and Earth with
Using the
Lunar lander
simulation, try to land the spacecraft using a minimum of fuel.
What is the minimum fuel needed for a soft landing? Describe the strategy you used.
Search the web for simulators for gravity, rocket launch, and lunar landing.
In the Android game "Osmos" you can experiment with maneuvering a spaceship in
a gravitational potential. Once the app is started, go to level 3 "solar".
The game is like Saturn's ring. You are a snowball in the ring surrounded by
other snowballs and you can observe the differential motion between nearby
snowballs. You can also change your momentum and observe the effect on your
orbit.
If you are on a circular orbit of radius R and you want to change to a circular
orbit of radius 2R, what is the most efficient strategy? How would you draw a
diagram to illustrate this?
The game is also like a model of an accretion disk. In the sun's accretion
disk, objects accumulated by gravity into planets and the same thing happens in
Osmos. Large objects tend to accumulate faster than small objects and the end
result is a set of planets with widely-separated orbits. This phenomenon is
mirrored in Osmos because in the game, large objects tend to accumulate faster
than small objects.
Suppose you want to play the game with the purpose of observing how accretion
works. You could move your spaceship to an orbit in the Kuiper belt so that it
doesn't interfere with the accretion. After the accretion has finished, what
does the result look like?
Suppose a ball is rolling on a table and you want to measure the velocity. You
can film a video of the ball as it rolls and you can arrange for it to roll
alongside a meter stick. Viewing the video frame-by-frame you can measure the
position and time of the ball for a set of different times. An example of a
set of measurements might look like:
The acceleration at Time=.50 can be approximated as:
Make a video of a ball rolling across a table and use the above procedure to generate a table
of positions, velocities, and accelerations.
Plot the following:
Roll a sphere down an inclined plane and measure the distance traveled
for the first 4 seconds. Let
Suppose you want to estimate how far a soccer ball travels before air drag slows
it down.
Expressed in terms of densities,
Find a slow-motion video of a curveball pitch on youtube.
Ideally the curve should be sideways so that the curve can be separated
from gravity.
Measure:
Calculate:
Find a youtube video showing a sprinter and a car accelerating from rest.
Estimate the position of the car every second.
From this data, construct an aproximate graph of the position, velocity,
and acceleration as a function of time.
The formula for the aerodynamic drag force is
If the balloon is moving at terminal velocity then the gravitational force is equal to
the drag force.
Drop the balloon and measure its terminal velocity, and also calculate it from the
formula. Use Constant=1.
For a person at terminal velocity,
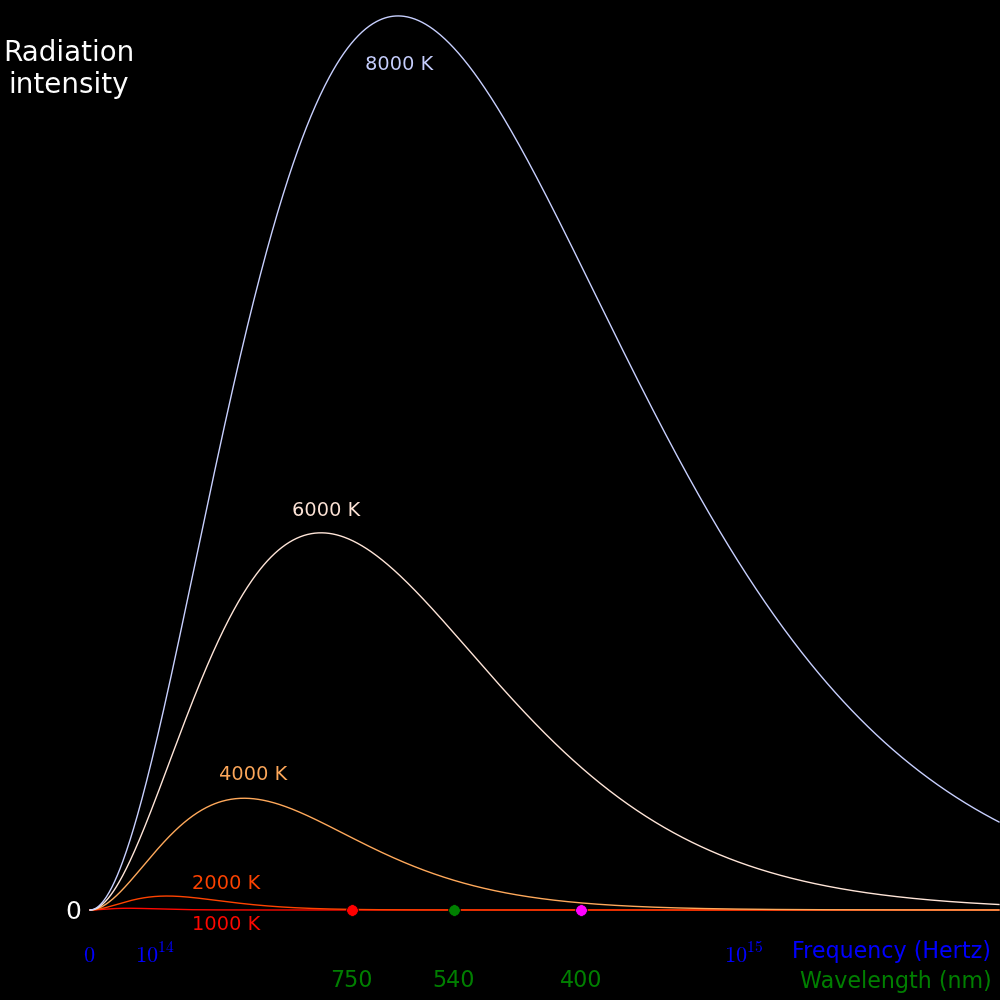
Humans can see light from 400 nm to 750 nm.
The Blackbody
radiation simualtion at phet.colorado.edu plots the blackbody spectrum as a function of
temperature. The area under the curve is the amount of energy produced by the blackbody.
You can subdivide the energy into bands. For example,
You can use the simulator to estimate the energy of each type by estimating the area under
the curve for the appropriate wavelength range.
In the figure above,
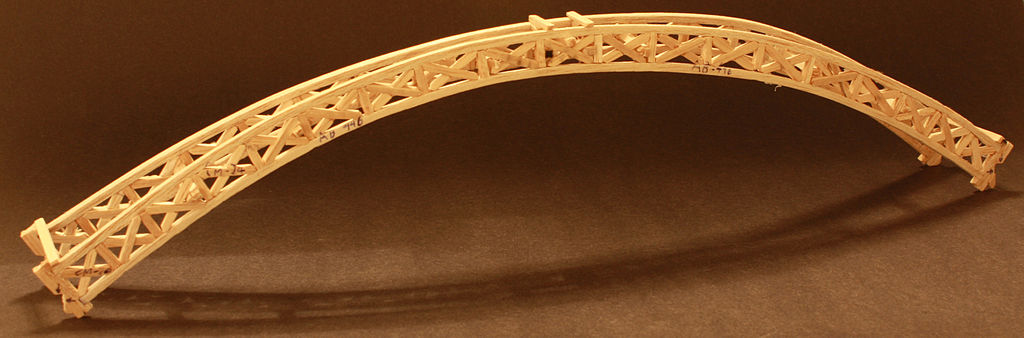
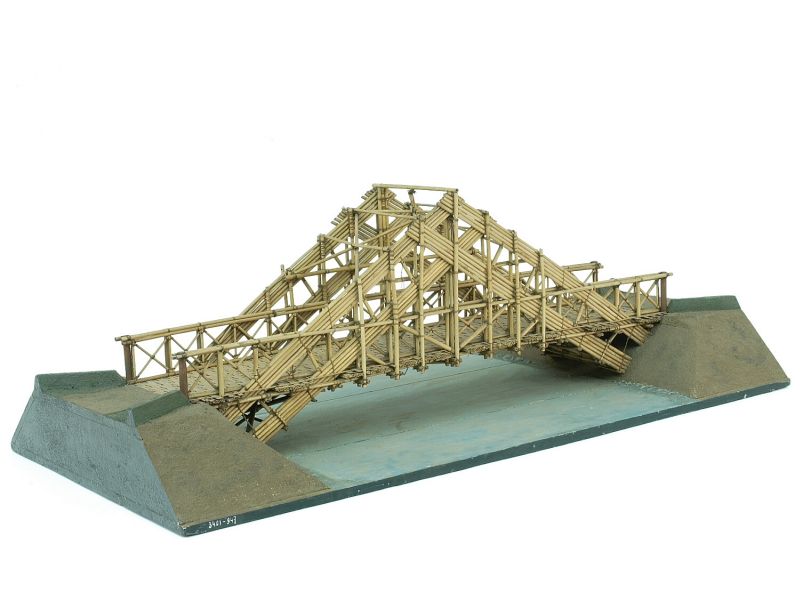
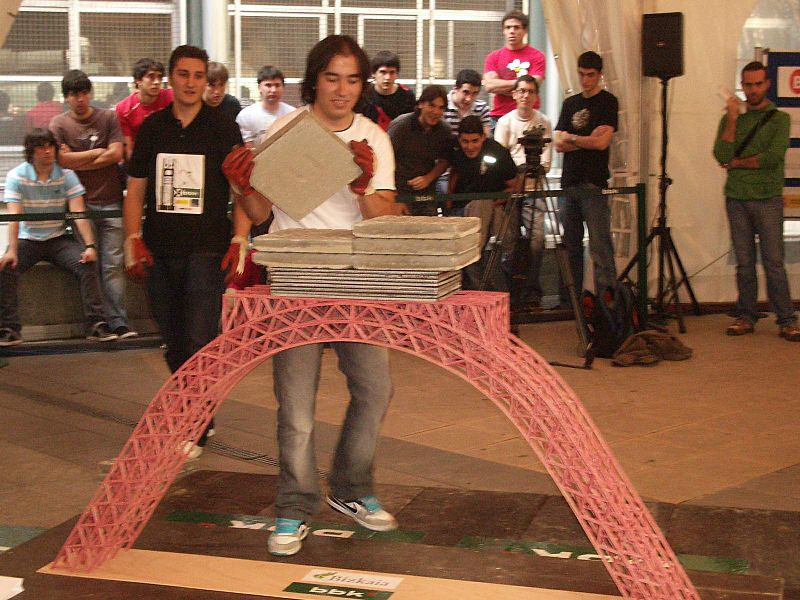
Build a bridge using the following materials:
To test the bridge, two tables will be placed 30 cm apart and the bridge will
be placed across the gap. Masses will be loaded on the bridge until it
breaks, and the score is the breaking is given as follows.
Build a tower 30 cm high. Weights will be placed on the tower until the tower
collapses and the score will be calculated similarly as the bridge score.
Build a catapult (trebuchet) to launch a projectile. You can design the
catapult so that it launches the projectile when a string is cut.
The drive mass is typically much larger than the projectile mass.
The properties of a wave are
A wave on a string moves at constant speed and reflects at the boundaries.
For a violin A-string,
If a wave is linear then waves add linearly and oppositely-traveling waves
pass through each other without distortion.
If two waves are added they can interfere constructively or destructively,
depending on the phase between them.
If a speaker system has 2 speakers you can sense the interference by
moving around the room. There will be loud spots and quiet spots.
The more speakers, the less noticeable the interference.
Noise-cancelling headphones use the speakers to generate sound that cancels
incoming sound.
Two waves traveling in opposite directions create a standing wave.
Waves on a string simulation at phet.colorado.edu
For example, the overtones of an A-string with a frequency of 440 Hertz are
Overtone simulation at phet.colorado.edu
An oboe and a clarinet are half-open pipes.
A cantilever has the same overtones as a half-open pipe.
A flute and a bassoon are pipes that are open at both ends and the overtones
are plotted in the figure above. In this case the overtones have twice the
frequency as those for a half-open pipe.
A closed pipe doesn't produce much sound. There are no instruments that are
closed pipes. A muted wind or bass instrument can be like a closed pipe.
Modes 1 through 5 for a closed pipe.
An oboe is a half-open pipe (open at one end), a flute is an open pipe (open at both
ends), and a string behaves like a pipe that is closed at both ends.
If a violin, an oboe, and a flute are all playing a note with 440 Hertz then the
overtones are
The fundamental mode is at the upper left. The number underneath each mode is
the frequency relative to the fundamental mode. The frequencies are not
integer ratios.
In general, overtones of a 1D resonator are integer multiples of the fundamental
frequency and overtones of a 2D resonator are not.
Wikipedia: Virations of a circular membrane
The whispering gallery in St. Paul's Cathedral has the same modes as a
circular drum.
Whispering gallery waves were discovered by Lord Rayleigh in 1878 while he was in
St. Paul's Cathedral.
Overtones are ubiquitous in vibrating systems. They are usually referred to as
"normal modes".
The vibration of the string depends on where it is plucked. Plucking the
string close to the bridge enhances the overtones relative to the fundamental
frequency.
A bow produces a sequence of plucks at the fundamental frequency of the string.
In a brass instrument your lips take the function of a reed.
A turbofan compresses the incoming airflow so that it can be combusted with fuel.
In a reed instrument, a puff of air enters the pipe, which closes the reed
because of the Bernoulli effect. A pressure pulse travels to the other and and
back and when it returns it opens the reed, allowing another puff of air to
enter the pipe and repeat the cycle.
Each of the two vocal chords functions like a string under tension. Changes in
muscle tension change the frequency of the vibration.
Male vocal chords tend to be longer than female vocal chords, giving males a
lower pitch. Male vocal chords range from 1.75 to 2.5 cm and female vocal chords
range from 1.25 to 1.75 cm.
When air passes through the vocal chords the Bernoulli effect closes them.
Further air pressure reopens the vocal chords and the cycle repeats.
The airflow has a triangle-shaped waveform, which because of its sharp edges
generates abundant overtones.
A spectrum tells you the power that is present in each overtone.
The first row is the waveform, the second row is the waveform expanded in time,
and the third row is the spectrum. The spectrum reveals the frequencies
of the overtones. In the panel on the lower left the frequencies are 300, 600, 900,
1200, etc. In the panel on the lower right there are no overtones.
A quality instrument is rich in overtones.
A waveform can be represented as an amplitude as a function of time or as an
amplitude as a function of frequency. A "Fourier transform" allows you to go
back and forth between these representations. A "spectrum" tells you
how much power is present at each frequency.
Fourier transform simulation
at phet.colorado.edu
Music analysis software such as "Audacity" can evaluate the spectrum.
Every instrument produces sound with a different character. The sound can
be characterized either with the waveform or with the spectrum
In the following plots the white curve is the waveform and the orange dots are
the spectrum.
Amati (1505-1577) lived in Cremona, Italy, and developed the first violins, violas,
and cellos.
Developed theories of eye focus, depth perception, color vision, and motion perception.
Invented the "Helmholtz resonator" for measuring the frequency spectrum of sound.
Discovered the shape of the oscillation of a violin string.
Demonstrated that different combinations of resonators could mimic vowel sounds.
Measured the speed of neurons.
Developed the principle of conservation of energy and demonstrated that it applies
to mechanics, heat, light, electricity and magnetism.
Demonstrated that muscle metabolism conserves energy.
Invented the field of psychology with his student Wilhelm Wundt.
In 1863, Helmholtz published "On the Sensations of Tone", which became the standard
reference for the next century.
Students: Max Planck, Heinrich Kayser, Eugen Goldstein, Wilhelm Wien, Arthur
Konig, Henry Augustus Rowland, Albert A. Michelson, Wilhelm Wundt, Fernando
Sanford and Michael I. Pupin.
The strings in a piano exert a force of 20 tons.
The Sydney Town Hall Grand Organ has pipes that are 64 feet long, which
corresponds to a frequency of 8.5 Hertz.
The left column is the change in decibel level provided by the soundproofing.
Noise is often characterized with a power spectrum because the properties
of soundproofing depend on frequency.
It is easier to stop high-frequency noise than low-frequency noise.
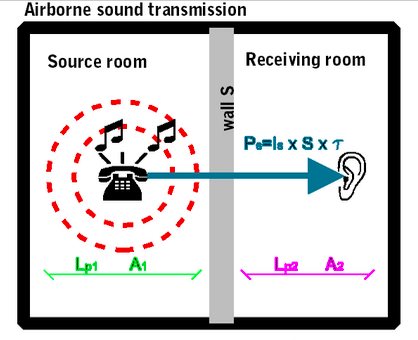
Sound transmission through the wall depends on the thickness of the wall.
The change in decibel level is proportional to the logarithm of the frequency.
Low-frequency waves are difficult to block.
It's better to have multiple thin walls than one thick wall.
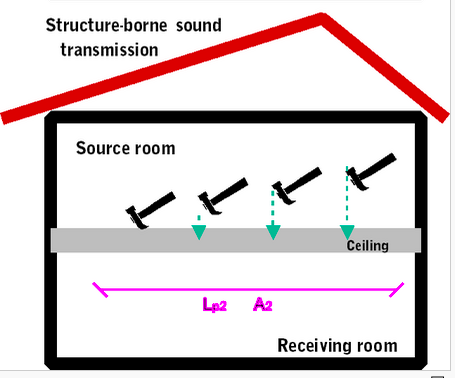
If a sound wave strikes a wall then only a small fraction of the energy is transmitted
through the wall. If an object strikes the wall then a substantial amount of energy
is transmitted through the wall. Carpets are a big help for soundproofing.
In rock, pressure waves propagate at ~ 5 km/s and shear waves propagate at ~ 3 km/s.
You can estimate the distance from the center of an earthquake by measuring the
time difference between the arrival of the pressure and shear waves.
If the wave speed doesn't depend on the frequency then waves propagate without
changing shape (without dispersion). This applies to all waves except for deep
water waves.
Obtain a spectrum app for your phone. "FrequenSee" works for Android and
"Garage Band" works for iPhone. Find any resonator (such as a pitchfork, a
string, or a bottle) and strike it so that it rings. Use the spectrum app to measure
the resonant frequencies. The resonant frequencies will appear as spikes in
the spectrum. Measure as many spikes as you can.
Try the experiment with different kinds of resonators. Use any resonator you can find.
1D resonators: Strings, rods, and bottles.
A wave on a string moves at constant speed and reflects at the boundaries.
For a violin A-string,
Build a musical instrument using rubber bands for strings. Invent a mechanism
for tuning the strings, such as like the pegs on a violin.
Give the instrument two identical strings and tune them to have the same frequency.
Measure the length and frequency of the string and calculate the wavespeed.
Suppose you play the left string open and the right string with a finger down.
Try all possible values of R from 1 to 4 and look for harmonious values. Record any values
you find.
If you have an actual stringed instrument, try the experiment with the instrument.
If you have a wind or brass instrument then try playing it together with another instrument.
Build an instrument that can play low frequency notes, the lower the better.
Use electrical amplification if available.
If the instrument is acoustic, try to make it as loud as possible.
Conduct an experiment to measure the sensitivity of human frequency perception.
For example, suppose you use a sound generator to produce a frequency of 440
Hertz and then slowly change the frequency until you notice that the frequency
has changed.
Let "Theta" be the characteristic angle for which you can sense the direction
of a sound. Conduct a set of experiments to measure Theta for various kinds of
sounds. What are the results for pure sine waves and for signals with abundant
overtones? What is the effect of noise?
Obtain an Online tone generator.
Using a smartphone power spectrum app such as FrequenSee (Android) or Garage
Band (Apple), play a note at 220 Hertz and draw the power spectrum for various
speakers, such as:
Headphones
Using any speaker, start from a frequency of 440 Hertz and observe the peak of
the lowest-frequency overtone. Decrease the frequency and watch the peak. At
the moment it vanishes, record the frequency "Fbass".
How accurately do the speakers reproduce overtones when played at large volume?
Try Frequency = 55, 110, 220, 440, and 880 Hertz.
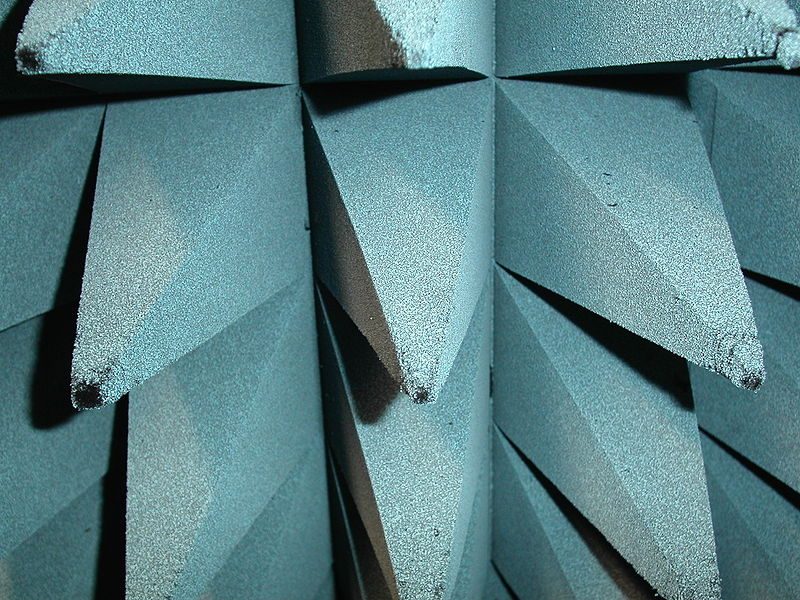
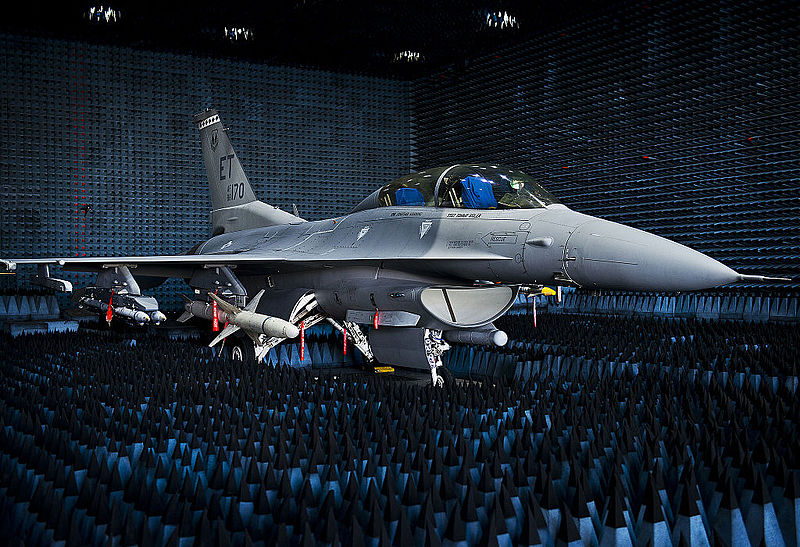
The walls of an anechoic chamber absorb all sound.
The absorbers are pointy to minimize the reflection of sound.
The information rate for sound is kilobytes/second and the rate for
vision is megabytes/second.
Build an anechoic chamber to be as silent as possible and measure the decibel
level. What measures did you have to take to reduce noise?
Obtain an app for measuring sound intensity and perform measurements in
any place you might be in Manhattan. Record the results.
Is there any place other than Central Park where you can't hear cars?
Use the app to measure the decibel reduction in sound when it passes through a wall.
Play a sound in an adjacent room and measure the sound level in the adjecent room and
the lab room.
Use a sound intensity app to measure the loudness of various instruments. Place
the microphone a standard 1 meter from the instrument for each instrument.
Measure the intensity of the lowest note and each octave above it.
After a string is plucked the amplitude of the oscillations decreases with time.
The larger the damping the faster the amplitude decays.
For example, you can strike a resonator and estimate how long it rings before
damping out, or you can record the waveform with Garage Band and use it to
estimate Tdamp.
You can break a wine glass by singing at the same frequency as the glass's
resonanant frequency. An expensive wineglass has a large quality factor.
The larger the quality factor, the easier it is to break the glass by singing.
We have reached the age of flying cars, jet packs, and wingsuits.
A glider is an airplane without an engine. It glides downward at a fixed angle
that is determined by the lift/drag coefficient.
Commercial airplanes fly at high altitude where the air is thin. The thinner the air,
the less the drag force and the less the energy required to travel a given distance.
The Wright brothers designed, manufactured, and sold their own line of bicycles
and used the profits to fund their aircraft research.
They began by designing wings and gliders.
They were the first to use wind tunnels to
test wings. Their wing design eclipsed the European designs.
They advanced the design of propellers.
Construct a wing and a wind tunnel and measure the following:
You will have to adjust the wing's "angle of attack" to get the optimal lift coefficient.
Build a glider using any materials available and try to minimze the glide
angle, which is defined as the change in height divided by the change in
lateral distance. Try different kinds of designs and see if you can optimize
the design.
To measure the glide ratio, launch the glider with zero initial velocity from a
height close to the ceiling and measure how far it travels before hitting the floor.
The glide ratio is equal to the lift coefficient.
Construct a propeller powered by a rubber band and construct a helicopter to
support the propeller. Place the helicopter on the ground and engage the
propeller and measure the maximum height that the helicopter reaches.
The propeller provides forward force and the wing provides upward force.
Combine a glider with a rubber-band-powered propeller to form a propeller
aircraft. Release it from at rest on the ground and measure the distance it flies.
X       =  Length of wire under zero tension force
x       =  Increase in length of the wire when a tension force is applied
K       =  Spring constant
Force   =  Tension force on the wire
        =  K x
Area    =  Cross-sectional area of the wire
Pressure=  Force / Area                  (Pressure, measured in Pascals or Newtons/meter2)
Strain  =  Fractional change in length of the wire     (dimensionless)
        =  x/X
Modulus =  Tensile modulus or "Young's modulus" for the wire material    (Pascals)
        =  Pressure / Strain
Starting from Hooke's law, we can derive an equation relating the modulus to the spring constant.
Force    =  Pressure * Area
         =  K * x
         =  K * X * x / X
         =  K * X * Strain
         =  Modulus * Area * Strain
Pressure =  (K * X / Area) * Strain
         =  Modulus * Strain
Modulus  =  K X / Area
K        =  Modulus * Area / X
X             =  Length of the wire
Area          =  Cross sectional area of the wire
Force         =  Force on the wire
x             =  Displacement of the wire when a force of "Force" is applied
K             =  Spring constant
              =  Force / x
Modulus       =  Tensile modulus
              =  K X / Area
xBreak        =  Displacement of the wire when it breaks
ForceBreak    =  Force required to break the wire
StrainBreak   =  Strain before the wire breaks
              =  xBreak / X
PressureBreak =  Pressure required to break the wire
              =  ForceBreak / Area
Toughness     =  Toughness of the material            (Joules/Volume)
              =  .5 * Modulus * Strainbreak2
Mass          =  Mass of the wire
Density       =  Density of the wire
              =  Mass / X / Area
Swordness     =  Toughness / Density
Plot "Force" as a function of "x" and use this to evaluate the spring constant "K".
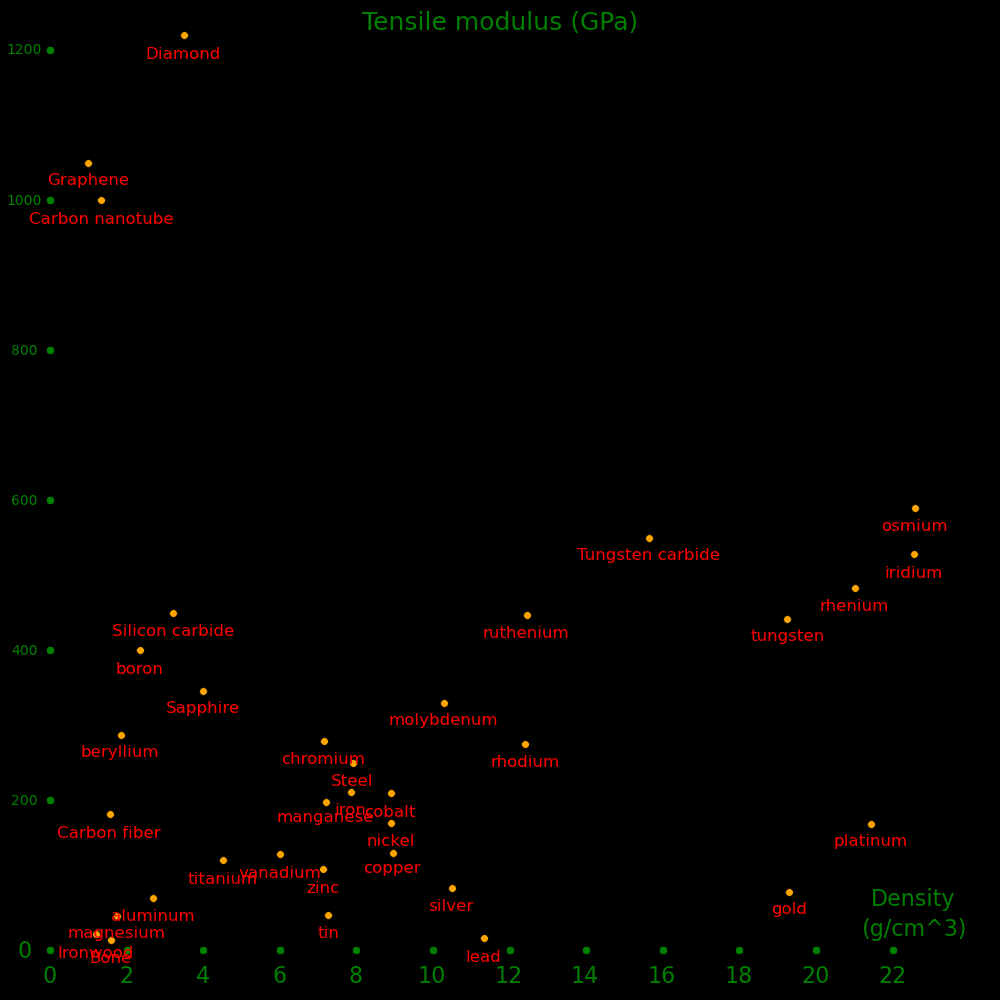
           Tensile  Breaking Breaking Tough  Tough/   Brinell  Density
           modulus  pressure strain          density  (GPa)    (g/cm3)
            (GPa)   (GPa)             (MPa)  (J/kg)
Beryllium    287     .448   .0016     .350     189       .6     1.85
Magnesium     45     .232   .0052     .598     344       .26    1.74
Aluminum      70     .050   .00071    .018      15       .245   2.70
Titanium     120     .37    .0031     .570      54       .72    4.51
Copper       130     .210   .0016     .170      19       .87    8.96
Bronze       120     .800   .0067    2.667     300              8.9
Iron         211     .35    .0017     .290      37       .49    7.87
Steel        250     .55    .0022     .605      77              7.9
Stainless    250     .86    .0034    1.479     185              8.0
Chromium     279     .282   .00101    .143     199      1.12    7.15
Molybdenum   330     .324   .00098    .159      15      1.5    10.28
Silver        83     .170   .0020     .174      17       .024  10.49
Tungsten     441    1.51    .0037    2.585     134      2.57   19.25
Osmium       590    1.00    .0018     .893      40      3.92   22.59
Gold          78     .127   .0016     .103       5.3     .24   19.30
Lead          16     .012   .00075    .045     3.8     .44     11.34

Rubber          .1   .016
Nylon          3     .075   .025     .938     815              1.15
Carbon fiber 181    1.600   .0088   7.07     4040              1.75
Kevlar       100    3.76
Zylon        180    5.80                                       1.56
Nanorope   ~1000    3.6     .0036      6.5    4980             1.3        Rope made from carbon nanotubes
Graphene    1050  160       .152   12190  12190000             1.0

Air            0    0      0          0        0                .0012
Water          0    0      0          0        0               1.00
Ice                  .001
Cork                low
Glass         45     .033                                      2.53
Concrete      30     .005                                      2.7
Granite       70     .025                                      2.7
Basalt               .030
Marble        70     .015                                      2.6

Bone          14     .130   .0093     604     377              1.6
Balsa
Pine                 .04
Oak           11
Bamboo               .50                                        .4
Ironwood      21     .181   .0086     780     650              1.2
Human hair           .380
Spider silk         1.0                                        1.3
Sapphire     345    1.9     .0055    5232    1315              3.98
Diamond     1220    2.8     .0023    3210     920     1200     3.5
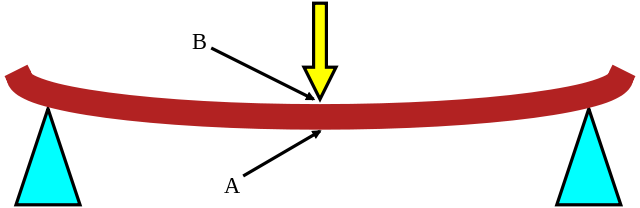
X             =  Length of the beam        (the largest dimension of the beam)
Y             =  Width of the beam
Z             =  Height of the beam        (parallel to the force applied)
Force         =  Force applied to the center of the beam.  The force is along the Z axis
x             =  Deflection of the center of the beam when a force is applied
K             =  Spring constant
              =  Force / x
Modulus       =  Tensile modulus
              =  (3/16) Force X3 / (X Y x Z3)
              =  (3/16) K X3 / (X Y Z3)
xBreak        =  Displacement of the beam when it breaks
ForceBreak    =  Force required to break the beam
StrainBreak   =  Internal strain on the beam when it breaks
              =  4 Z xBreak / X2
PressureBreak =  Internal pressure in the beam material when it breaks
              =  Strainbreak * Modulus
Toughness     =  Toughness of the material          (Joules/Volume)
              =  .5 * Modulus * Strainbreak2
Mass          =  Mass of the beam
Density       =  Density of the beam
              =  Mass / (X Y Z)
Swordness     =  Toughness / Density
Plot "Force" as a function of "x" and use this to evaluate the spring constant "K".
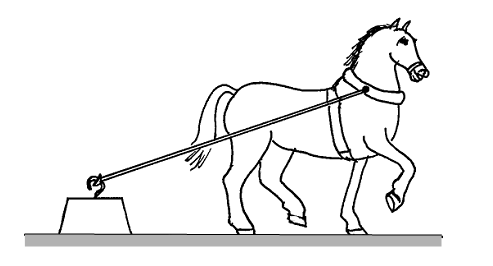
Msled   =  Mass of a sled resting on a table
Mhang   =  Mass of a weight hanging from the string
Gravity =  Gravity constant
        =  9.8 meters/second2
Force   =  Force of the sled on the table
        =  Msled * Gravity
Area    =  Surface area of the sled that is in contact with the table
Friction=  Minimum transverse force required to overcome friction and move the sled
        =  Minimum force on the wire required to move the sled
        =  Q * Force
        =  Mhang * Gravity
Q       =  Coefficient of friction
        =  Friction / Force
        =  Mhang    / Msled
Construct a sled and place masses on the sled. Attach a wire to the sled and use the wire
to generate a sideways force. Gradually increase the sideways force until the object starts to
move. This is the value of "Friction", the friction force required to move the object.
Surface   Surface         Friction
  #1        #2           coefficient

Concrete  Rubber            1.0
Steel     Steel              .8
Wood      Wood               .4
Metal     Wood               .3
Concrete  Rubber (wet)       .3
Wood      Ice                .05
Ice       Ice                .05
Steel     Ice                .03
         Mass     Position     Velocity
                    X    Y     X    Y

Body 1    100.      0    0     0    0      Star
Body 2      1.    100    0     0    V      Planet
"V" is the velocity of the planet. For what value of V does the planet orbit
the star as a circle? What does the formula below predict for V?
A  =  Pericenter  =  Distance between the star and planet when the planet is closest to the star
B  =  Apocenter   =  Distance between the star and planet when the planet is furthest to the star
If V is small then B=100 and A<100.
For what value of V is A=10?
R  =  Planet X coordinate
Vc =  Velocity for a circular orbit
Ve =  Velocity for escape
G  =  Gravity constant
   =  10000  for the simulator
A  =  Gravitational acceleration
M  =  Star mass
m  =  Planet mass
For a planet on a circular orbit,
Gravitational Force  =  Centripetal force
    G M m / R2      =  m Vc2 / R

Vc  =  (GM/R)1/2
For a planet to escape the star,
Gravitational energy  =  Kinetic energy
     G M m / R        =    .5 m Ve2

Ve  =  (2GM/R)1/2  =  Squareroot(2) * Vc
         Mass       Position    Velocity
                     X    Y     X    Y

Body 1    100.       0     0     0    0      Star
Body 2       .01   100     0     0  100      Planet 1
Body 3       .01     x     0     0    v      Planet 2
To give Planet 2 a circular orbit, use
v  =  1000 / Squareroot(x)

 x     v
100   100
105    98
110    95
115    93
120    91
125    89
130    88
135    86
140    85
145    83
150    82
If "x" is close to 100 then the planets interfere
gravitationally, and if "x" is far from 100 the planets ignore each other.
![]()
![]()
        Mass         Position   Velocity
                      X    Y     X   Y

Body 1  100.          0    0     0    0    Sun
Body 2     .000219  100    0     0  100    Earth
Body 3     .000032  152    0     0   81    Mars
In a Hohmann maneuver a spaceship starts at the Earth and fires its rockets in the
Y direction, in the same direction as the Earth's velocity.
Vearth  =  Earth velocity
Vlaunch =  Departure velocity of the rocket with respect to the Earth
Vtotal  =  Total rocket velocity
        =  Vearth + Vlaunch
If Vlaunch has the right value then the rocket's orbit will graze Mars' orbit.
If Vlaunch is too low then the rocket won't make it to Mars.
If Vlaunch is too high then you will get to Mars faster but you will use more than the minimum
amount of fuel. If Vlaunch is such that the rocket grazes Mars' orbit then you're using the minimum
amount of fuel.
        Mass         Position     Velocity
                      X    Y     X   Y

Body 1  100.          0    0     0    0    Sun
Body 2     .000219   72    0     0  118    Venus
Body 3     .000303   86    0     0  108    Tatooine, a clone of the Earth that is closer to the sun
Body 4     .000303  100    0     0  100    Earth
Is this system stable? How large do you have to make the mass of the middle planet to make
the system unstable?
 Time   Position
 (s)      (m)

  .0      .000
  .5      .100
 1.0      .195
 1.5      .285
 2.0      .370
 2.5      .450
 3.0      .525
The velocity at Time=.25 can be approximated as:
x  =  Position at Time=.0
   =  .100
X  =  Position at Time=.5
   =  .000
T  =  Time difference between the two position measurements
   =  .5 - .0
   =  .5
V  =  Velocity at Time=.25
   =  Change in position divided by the change in time.
   =  (X - x) / T
   =  (.100 - .000) / .5
   =  .2  meters/second
Similarly, the velocity at Time=.75 can be approximated as:
x  =  Position at Time= .5
   =  .100
X  =  Position at Time=1.0
   =  .195
T  =  Time difference between the two position measurements
   =  1.0 - .5
   =  .5
V  =  Velocity at Time=.75
   =  (X - x) / T
   =  (.195 - .100) / .5
   =  .19  m/s
Continuing, we can generate a table of velocities.
 Time   Position   Velocity
 (s)      (m)      (m/s)

  .0      .000
  .25               .2
  .5      .100
  .75               .19
 1.0      .195
 1.25               .18
 1.5      .285
 1.75               .17
 2.0      .370
 2.25               .16
 2.5      .450
 2.75               .15
 3.0      .525
From the table you can tell that the object starts out with a velocity of .20 and is decelerating.
v  =  Velocity at Time=.25
   =  .20
V  =  Velocity at Time=.75
   =  .19
T  =  Time difference between the two velocity measurements
   =  .75 - .25
   =  .5
A  =  Acceleration at Time=.50
   =  Change in velocity divided by the change in time
   =  (V - v) / T
   =  (.20 - .19) / .5
   =  -.02  meters/second2
We can continue the procedure to produce a table of velocities and accelerations.
 Time   Position   Velocity   Acceleration
 (s)      (m)      (m/s)      (m/s2)

  .0      .000
  .25               .2
  .5      .100                 -.02
  .75               .19
 1.0      .195                 -.02
 1.25               .18
 1.5      .285                 -.02
 1.75               .17
 2.0      .370                 -.02
 2.25               .16
 2.5      .450                 -.02
 2.75               .15
 3.0      .525
Position as a function of time
Velocity as a function of time
Acceleration as a function of time
.gif)
X1  =  Distance traveled after 1 seconds
X2  =  Distance traveled after 2 seconds
X3  =  Distance traveled after 3 seconds
X4  =  Distance traveled after 4 seconds
If the acceleration is constant then
R2  =  X2/X1  =  4
R3  =  X3/X1  =  9
R4  =  X4/X1  = 16
Measure X1, X2, X3, X4, and calculate R2, R3, R4.
M  =  Mass of the 2014 World Cup "Brazuka" ball  =  .437 kg
R  =  Ball radius                                =  .110 meters
D  =  Ball density                               =  78.4 kg/meters3
A  =  Ball cross-sectional area                  =  .0380 meters2
V  =  Ball initial velocity
d  =  Density of air                             =  1.2 kg/meter3
F  =  Aerodynamic drag force                     =  .5 D A V2
L  =  Characteristic distance the ball travels before slowing down
m  =  Mass of air that a ball passes through
      after moving a distance L
   =  A L d
Newton observed that the characteristic distance L is such that
m = M
Hence
L = M / (A d)
  = 9.6 meters
The depth of the penalty box is 16.45 meters (18 yards).
Any shot taken outside the penalty box slows down substantially before reaching the
goal.
L = 4/3 R D / d
Newton was also the first to observe the "Magnus effect", where spin causes
a ball to curve.
The time required for the pitch to travel from the pitcher's mound to the plate,
The number of rotations the ball undergoes on its way to the plate
The sideways deflection of the pitch.
The average velocity of the ball.
The spin on the ball in radians/second
The sideways force and acceleration on the ball.
Area        =  Cross sectional area of the object in meters2
Velocity    =  Velocity of the object in meters/second
Density     =  Density of air
            =  1.22 kg/m3
Mass        =  Mass of the object
Constant    =  Dimensionless drag constant, usually equal to 1
Force       =  Aerodynamic drag force on the object
            =  .5 * Constant * Density * Area * Velocity2
Acceleration=  Force / Mass

Constant    =  2 * Mass * Acceleration / (Density * Area * Velocity2)
![]()
Gravitational force on the balloon  =  Drag force on the balloon
        Mass * Gravity              =  .5 * Constant * Density * Area * Velocity2
The terminal velocity is
Velocity2   =  Mass * Gravity * 2 / Constant / Density / Area
            =  Mass * 9.8     * 2 /    1     /  1.22   / Area
            =  16.1 * Mass / Area
Inflate a balloon and measure its mass and area.
Mass    =  100 kg
Area    =  1 meter2
Velocity=  40 m/s
Estimate the diameter of a parachute that gives a 100 kg person a terminal
velocity of 5 m/s.
This plot shows the energy as a function of frequency emitted by a blackbody of various
temperature. Visible light ranges from the red dot to the magenta dot.
Type of light             Wavelength
                            (nm)
Threshold for cell damage   300
Magenta limit of vision     400
Magenta                     440
Blue                        480
Cyan                        520
Green                       555
Yellow                      620
Red                         700
Red limit of photosynthesis 680
Red limit of vision         750
Light is harmful if it has a wavelength smaller than 300 nm.
Photosynthesis can use light from 300 nm to 680 nm, except for the green light at 555 nm.
Energy           Largest     Smallest
type            wavelength  wavelength
                  (nm)         (nm)

Infrared        Infinity       680       Energy in the infrared, not usable by photosynthesis
Photosynthesis    680          300       Energy useable by photosynthesis
UV                300            0       Energy in UV that is damaging to cells
Total           Infinity         0       Total energy
UV energy              =  Area of the gray area to the left
Photosynthesis energy  =  Area of the rainbow zone
Infrared energy        =  Area of the gray area to the right
The sun has a temperature of 6000 Kelvin. Using the simulator, estimate the values of
Infrared energy        /  Total energy
Photosynthesis energy  /  Total energy
UV energy              /  Total energy
Estimate the temperature of a black body for which
UV energy / Total energy = 1/100


Wood (tongue depressor, toothpick, chopstick, etc.)
Paper (regular paper or file folder paper)
Superglue
Cotton string
Duct tape
Plastic straw
Mbreak  =  Mass required to break the bridge
Mbridge =  Mass of the bridge   (40 grams maximum)
S      =  Score of the bridge
       =  Mbreak / Mbridge
Mbreak  =  Mass required to break the tower
Mtower  =  Mass of the tower   (40 grams maximum)
S      =  Score of the tower
       =  Mbreak / Mtower


Mcat  =  Mass of the catapult  (40 grams maximum)
Mdrive=  Mass of the object used to drive the catapult  (can have any value)
Mproj =  Mass of the projectile launched by the catapult  (can have any value)
X    =  Distance the projectile travels, measured from the front of the catapult
S    =  Score of the catapult
     =  X Mproj


Frequency  =  F  (seconds-1)
Wavelength =  W  (meters)
Wavespeed  =  V  (meters/second)
Period     =  T  (seconds)  =  The time it takes for one wavelength to pass by
Wave equations:
F W = V

F T = 1
A train is like a wave.

Length of a train car =  W  =  10 meters         (The wavelength)
Speed of the train    =  V  =  20 meters/second  (The wavespeed)
Frequency             =  F  =  2 Hertz           (Number of train cars passing by per second)
Period                =  T  =  .5 seconds        (the time it takes for one train car to pass by)

Speed of sound at sea level    =  V  =  340 meters/second
Frequency of a violin A string =  F  =  440 Hertz
Wavelength of a sound wave     =  W  =  .77 meters  =  V/F
Wave period                    =  T  =  .0023 seconds

Frequency                           =  F  =  440 Hertz
Length                              =  L  =  .32 meters
Time for one round trip of the wave =  T  =  .0023 s  =  2 L / V  =  1/F
Speed of the wave on the string     =  V  =  688 m/s  =  F / (2L)

String equation:  2 L V = F


In a reed instrument, a puff of air enters the pipe, which closes the
reed because of the Bernoulli effect. A pressure pulse travels to the other
and and back and when it returns it opens the reed, allowing another puff of
air to enter the pipe and repeat the cycle.


Whan a wave on a string encounters an endpoint it reflects with the waveform
preserved and the amplitude reversed.


When an string is played it creates a set of standing waves.
L  =  Length of a string
V  =  Speed of a wave on the string
N  =  An integer in the set {1, 2, 3, 4, ...}
W  =  Wavelength of an overtone
   =  2 L / N
F  =  Frequency of the overtone
   =  V/W
   =  V N / (2L)

N = 1  corresponds to the fundamental tone
N = 2  is one octave above the fundamental
N = 3  is one octave plus one fifth above the fundamental.
Audio: overtones
Overtone  Frequency   Note

   1         440       A
   2         880       A
   3        1320       E
   4        1760       A
   5        2200       C#
   6        2640       E
   7        3080       G
   8        3520       A


In the left frame the pipe is open at the left and closed at the right.
In the right frame the pipe is reversed, with the left end closed and the right
end open. Both are "half-open pipes".
L  =  Length of the pipe
   ~  .6 meters for an oboe
V  =  Speed of sound
N  =  An odd integer having values of {1, 3, 5, 7, ...}
W  =  Wavelength of the overtone
   =  4 L / N
F  =  Frequency of the overtone
   =  V / W
   =  V N / (4L)
The overtones have
N = {1, 3, 5, 7, etc}


L  =  Length of the pipe
V  =  Speed of sound
N  =  An odd integer having values of {1, 3, 5, 7, ...}
W  =  Wavelength of the overtone
   =  2 L / N
F  =  Frequency of the overtone
   =  V / W
   =  V N / (2L)


A string has the same overtones as a closed pipe.


An instrument of length L has overtones with frequency
Frequency = Z * Wavespeed / (2 * Length)
Z corresponds to the white numbers in the figure above.
Violin      440, 2*440, 3*440, 4*440, ...
Oboe        440, 3*440, 5*440, 7*440, ...
Flute       440, 3*440, 5*440, 7*440, ...


In 1787 Chladni published observations of resonances of vibrating plates.
He used a violin bow to generate a frequency tuned to a resonance of the plate
and the sand collects wherever the vibration amplitude is zero.


The interior of a football is a spherical resonator.


As a sound waves travels back and forth along the clarinet it forces the reed to
vibrate with the same frequency.
In the figure, as the flow constricts it speeds up and drops in pressure.

P  =  Pressure
V  =  Fluid velocity
H  =  Height
g  =  Gravity  =  9.8 meters/second^2
D  =  Fluid density
The bernoulli principle was published in 1738. For a steady flow, the value of "B"
is constant along the flow.
B = P + .5 D V^2 + D g H
If the flow speeds up the pressure goes down and vice versa.


A wing slows the air underneath it, inreasing the pressure and generating lift.
In the right panel, air on the top of the wing is at increased speed and
reduced pressure, causing condensation of water vapor.


Lift incrases with wing angle, unless the angle is large enough for the airflowto stall.


The vocal tract is around 17 cm long. For a half-open pipe this corresponds to
a resonant frequency of
Resonant frequency  =  WaveSpeed / (4 * Length)
                    =  340 / (4*.17)
                    =  500 Hertz
One has little control over the length of the vocal pipe but one can change the
shape, which is how vowels are formed.


 500 - 1400  Medieval
1400 - 1600  Renaissance
1600 - 1760  Baroque         Monteverdi, Vivaldi, Bach, Handel
1720 - 1770  Galant          Gluck
1730 - 1820  Classical       Mozart
1780 - 1910  Romantic        Beethoven, Brahms, Wagner
1890 -  Now  Modern          Prokofiev, Shostakovich
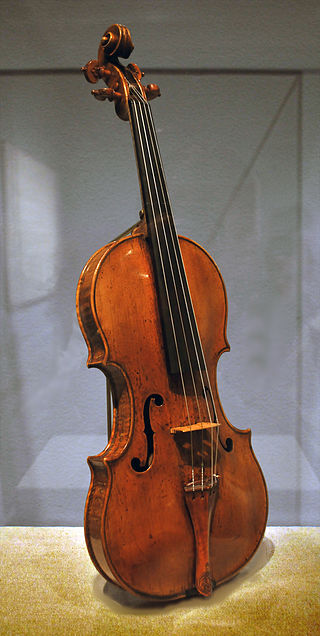
This violin, now at the Metropolitan Museum of Art, may have been part
of a set made for the marriage of Philip II of Spain to Elisabeth of Valois in
1559, which would make it one of the earliest known violins in existence.
Invented the opthalmascope, an instrument for examining the inside of the eye.


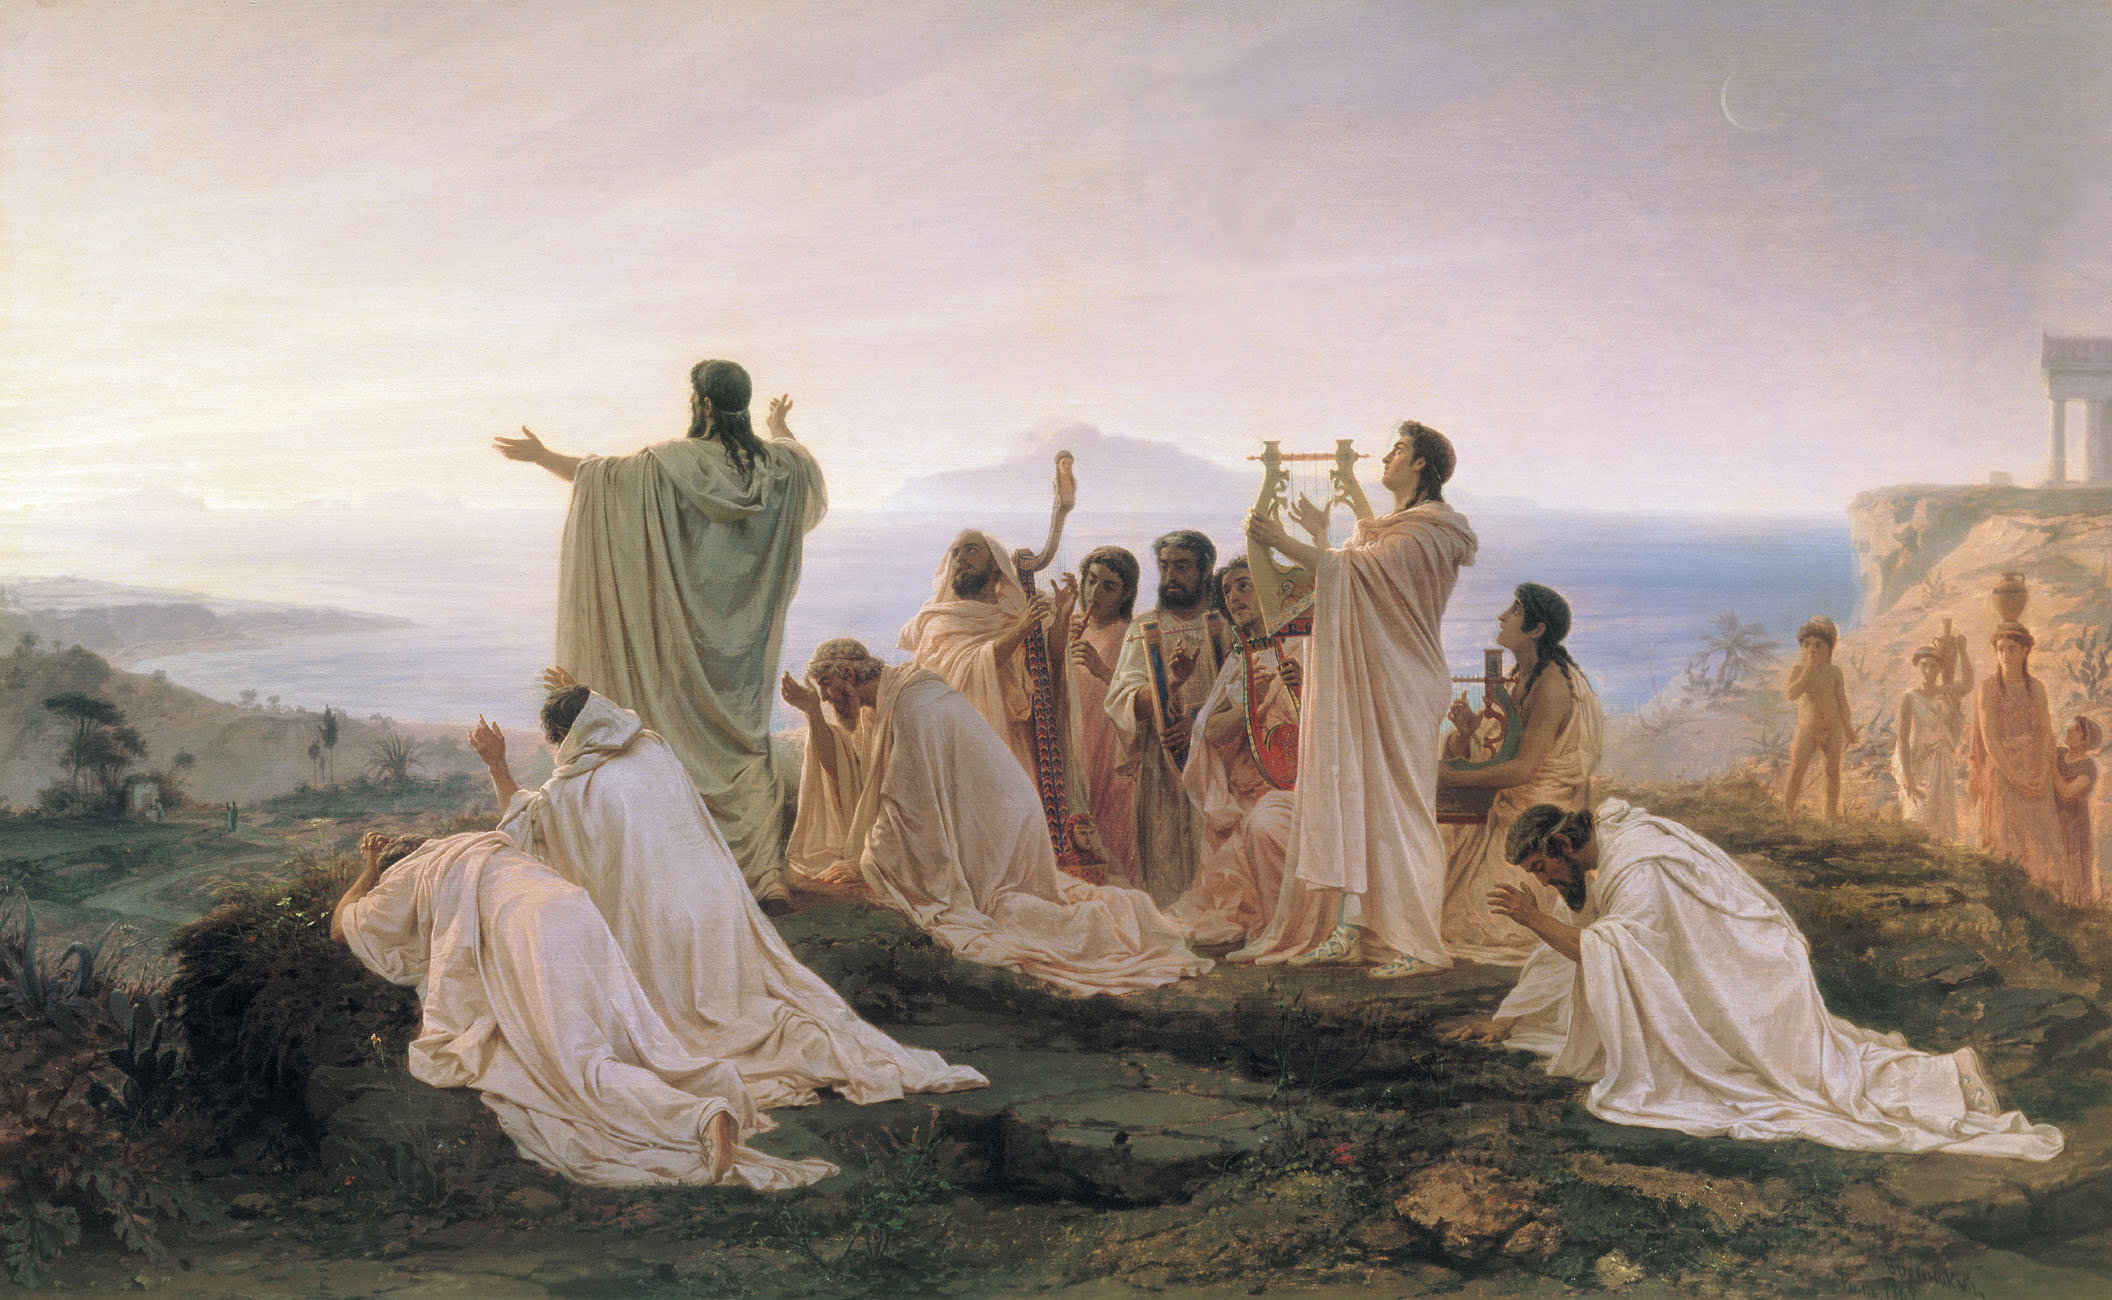
-2500  An ensemble of lyres was played in the ancient city of Ur, including
       lyres, harps, flutes, and reed instruments.
 1000  Bowed instruments first developed, such as the Lyre
 1200  The guitar comes into use in Europe
 1555  Amati develops the four-string violin
 1700  Cristofori develops the first piano, an instrument where the string is
       struck by a hammer.  Early pianos had 5 octaves
 1785  Tourte develops the modern bow
 1810  Broadwood develops a 6-octave piano
 1820  Broadwood develops a 7-octave piano
 1821  Erard develops the double-escapement mechanism for the piano, a
       device that permitted repeating a note even if the key had not yet risen
       to its maximum vertical position. This facilitated rapid playing
       of repeated notes.
 1835  Tuba invented
 1847  Boehm advances the design of the flute, including a switch from wood to metal
 1931  Beauchamp builds the first electric guitar


A harpshichord string is plucked and a piano string is hammered.
A harpsichord can't vary its volume.


25   Normal speech can be understood quite easily and distinctly through wall
30   Loud speech can be understood fairly well, normal speech heard but not understood
35   Loud speech audible but not intelligible
45   Loud speech not audible
50   Very loud sounds such as musical instruments or a stereo can be faintly heard;
60   Most sounds inaudible
Table for the reduction in intensity of sound for various kinds of walls.
Values in decibels.
33  Typical interior wall
46  6 inch hollow concrete masonry
50  10 inch hollow concrete masonry
L       =  Thickness of a wall
Dair    =  Density of air
Dwall   =  Density of wall material
P       =  Characteristic pressure fluctuation of a sound wave striking the wall
V       =  Characterstic velocity fluctuation of a sound wave striking the wall
T       =  Wave period
F       =  Wave frequency
        =  1/T
Vwall   =  Characteristic recoil velocity of a wall upon being struck by a sound wave

V^2  ~  P / Dair
The impulse per area delivered to the wall is
Impulse / Area  ~  P T
                ~  Dair T V^2
The impulse per area is equal to the momentum per area delivered to the wall
Dair T V^2  ~  Dwall L Vwall

Vwall  ~  (Dair/Dwall) V^2 / (LF)
The wall recoil generates a sound wave on the other side of the wall with a
characteristic fluctuation magnitude of Vwall.
The decibel level is proportional to the logarithm of the velocity.
log(Vwall) = Constant - log(L) - log(F)
The change in decibel level is proportional to the logarithm of the wall thickness.
It's better to divide a wall into many layers rather than having one solid wall.


Wave type            Wave speed squared

Sound in air         1.4*Pressure / Density
String wave          Tension      / Density / CrossSection
Longitudinal wave    BulkModulus  / Density
Shear wave           ShearModulus / Density
Torsion wave         ShearModulus / Density
Deep water wave      GravityConstant * Wavelength / (2 Pi)    (If Depth > .5 Wavelength)
Shallow water wave   GravityConstant * Depth                  (If Depth < .5 Wavelength)

GravityConstant = 9.8 meters/second^2
           Bulk      Density   Sound speed
          modulus    (g/cm^3)    (km/s)
           (GPa)
Air           .00014   .0012      .34
Water        2.2      1.0        1.43
Wood        13        1          3.6
Granite    100        2.75       6.0
Steel      170        7.9        6.1
Diamond    443        3.5       12.0
Beryllium  130        1.85      12.9         Fastest sound speed of any material
F1  =  Frequency of the lowest-frequanty spike
F2  =  Frequency of the spike with the next highest frequency after F1
F3  =  Frequency of the spike with the next highest frequency after F2
F4  =  etc.
R2  =  F2 / F1
R3  =  F3 / F1
R4  =  F4 / F1
Calculate R2, R3, R4, etc., for as many spikes as the
resonator has.
2D resonators: Drums, plates, the body of a stringed instrument.
3D resonators: Interior of a soccer ball or globe.
Frequency of the lowest-frequency note  =  F  =  440 Hertz
Length of the string                    =  L  =  .32 meters
Time for one round trip of the wave     =  T  =  .0023 s  =  2 L / V  =  1/F1
Speed of the wave on the string         =  V  =  688 m/s  =  F1 / (2L)

String equation:  2 L V = F
For each of the resonators from the previous lab, measure the length of the
resonator and the frequency of the lowest-frequency note and use them to
calculate the wavespeed V.


.jpg)
L1  =  Length of the open left string
L2  =  Length of the right string, from one end to the finger
      This is the active part of the string that can vibrate when you pluck it.
      L1 > L2
R  =  Frequency ratio between the two notes.
   =  L1 / L2
Pythagoras tried different values of R and found that some values sound harmonious
and others sound dissonant.
F      =  Original frequency
       =  440 Hertz
Fwidth =  Characteristic width for frequency perception at a frequency of F
R      =  Charactistic frequency ratio for frequency perception
       =  Fwidth / F
Suppose you start with a frequency of "F" and slowly change it to a different
frequency "f".
If   |f-F|  <  Fwidth               then "f" sounds the same as "F"
If   |f-F|  >  Fwidth               then "f" sounds different from "F"
Conduct an experiment to measure the value of R for a range of frequencies F,
and describe the experiment. This isn't intended to be a high-precision measurement.
Any estimation will do.
Smartphone
Tablet
Laptop
Desktop
The large speaker in the lab
Fbass  =  Lowest frequency that a speaker can produce
D     =  Diameter of the speaker
Measure Fbass and D for each of the speakers listed above.


F    =  Frequency of the string
T    =  Time for one oscillation of the string
     =  1/F
Tdamp=  Characteristic timescale for vibrations to damp
q    =  "Quality" parameter of the string
     =  Characteristic number of oscillations required for the string to damp
     =  Tdamp / T
     =  Tdamp * F
The smaller the damping the larger the value of q.
For most musical instruments, q > 100.

For various resonators, measure Tdamp and F and use them to estimate
the quality factor q = Tdamp F.


.jpg)


_cropped.jpg)


D    =  Air density
V    =  Velocity
Awing =  Wing area
Cwing =  Wing drag coefficient
Fdrag =  Drag force on the wing  =  .5 CWing D Awing V2


             Cwing

F-4 Phantom   .021     (subsonic)
Cessna 310    .027
Airbus A380   .027
Boeing 747    .031
F-4 Phantom   .044     (supersonic)
Flift  =  Lift force (upward)
Fdrag  =  Drag force (rearward)
Qlift  =  Lift-to-drag coefficient  =  Flift / Fdrag

              Qlift

U-2            23     High-altitude spy plane
Albatross      20     Largest bird
Gossamer       20     Gossamer albatross, human-powered aircraft
Hang glider    15
Tern           12
Herring Gull   10
Airbus A380     7.5
Concorde        7.1
Boeing 747      7
Cessna 150      7
Parachute       5
Sparrow         4
Wingsuit        2.5
Flying lemur    ?     Most capable gliding mammal.  2 kg max
Flying squirrel 2.0
Qlift =  Wing lift/drag coefficient
Vx   =  Horizontal velocity of the glider
Vz   =  Vertical velocity of the glider
Fdrag =  Drag force
Fgrav =  Gravitational force
Flift =  Lift force         =  Fgrav
Pdrag =  Drag power         =  Fdrag Vx
Pgrav =  Power from gravity =  Fgrav Vz
If the glider descends at constant velocity,
Pdrag = Pgrav
The goal of a glider is to maximize the glide ratio Vx / Vz.
Vx / Vz  =  (Pdrag / Fdrag)  /  (Pgrav / Fgrav)
         =  Fgrav / Fgrav
         =  Flift / Fdrag
         =  Qlift
The glide ratio is equal to the lift coefficient Qlift.
D    =  Air density
Awing =  Wing area
Cwing =  Wing drag coefficient
Fdrag =  Drag force on the wing   =  .5 Cwing D Awing V^2
Qwing =  Wing lift coefficient    =  Flift / Fdrag
Flift =  Lift force from the wing =  Qwing Fdrag
M    =  Aircraft mass
Feng  =  Engine force
Fgrav =  Gravity force            =  M g
Pdrag =  Drag power               =  Fdrag V  =  .5 Cwing D Awing V3
V    =  Cruising speed
Agility= Power-to-weight ratio    =  Pdrag / M  =  V g / Q      (derived below)
For flight at constant velocity,
Feng  =  Fdrag              Horizontal force balance

Flift =  Fgrav              Vertical force balance

Agility =  Pdrag   / M
        =  Fdrag V / M
        =  Flift V / M / Q
        =  M g V  / M / Q
        =  V g / Q
We can use this equation to solve for the minimum agility required to fly.
Pdrag  =  M g V / Q  =  .5 Cwing D Awing V3

Agility  =  g3/2 M1/2 Q-3/2 (.5 C D A)-1/2
If we assume that mass scales as size cubed and wing area scales as size squared,
then
Awing   ~  M2/3

Agility ~  g3/2 M1/6 Q-3/2 C-1/2 D-1/2
Vstall  =  Stall velocity, the minimum velocity for flight
Vcruise =  Optimal cruising velocity
Vmax    =  Maximum velocity
Param  =  Drag parameter  =  F / V2
Cwing   =  Wing drag coefficient
Qlift   =  Wing lift-to-drag ratio


           Vstall  Vcruise  Vmax  Mass  Density Force  Power Param  Cwing  Wing   Qlift
            m/s    m/s     m/s  ton   kg/m^3   kN     kW                 m^2

Hang glider                                                                      15
Gossamer             3.5    8.1   .10                  .3                 41.34  20
Cessna 150     22   42     56     .60                  75          .027   15      7
U-2           180  192    200    6.486  .050                                     23
Boeing 747         254    274  184.6          1128                 .031  525      7
Airbus A380        320                  .28    153  49000   1.50   .027  845
Concorde           599    605   78.7           676                       358.2    7.1
-4 Phantom                                                         .021
F-4 Phantom                                                        .044
F-22 Raptor               740           .084    31  32000    .057
SR-71                    1100           .038    30  33000    .025
Albatross                                                                        20
Tern                                                                             12
Herring Gull                                                                     10
Sparrow                                                                           4
Wingsuit                                                                          2.5
Mach 1 = 298 m/s.
                Altitude   Density
                  (km)     (kg/m3)

Sea level          0       1.22
Cessna 150         3.0
Airbus A380       13.1      .28
Concorde          18.3
F-22 Raptor       19.8      .084
U-2               21.3      .050
SR-71 Blackbird   25.9      .038
1961  Piggott accomplishes the first human-powered flight, covering a distance
      of 650 meters.
1977  The "Gossomer Condor 2" flies 2172 meters in a figure-eight and wins
      the Kremer Prize.  It was built by Paul MacCready and piloted by amateur
      cyclist and hang-glider pilot Bryan Allen.
      It cruised at 5.0 m/s with a power of 260 Watts.
1988  The MIT Daedalus 88 piloted by Kanellos Kanellopoulos flies from Crete
      to Santorini (115.11 km), setting the distance record, which still stands.
Human-powered helicopters can only reach a height of 3 meters and can only hover
for 20 seconds.
               Mass    Power   Agility
               (kg)    (kW)   (Watts/kg)

Human             75    2500     33
BMW i8          1485     170    114
Cessna 150       600      75    125
Airbus A380   276000   49000    178
Formula-1 car    642     619    964
SR-71          30600   33000   1078
F-22 Raptor    19700   33000   1675
If you put a wing on a BMW i8, it would be able to go fast enough to take off.
Xwing =  Length of the wing, from the fuselage to the tip
Ywing =  Wing dimension in the direction of flight,
        measured along the point of attachment with the fuselage
Awing =  Wing area
Rwing =  Wing aspect ratio   =  Xwing / Ywing
Qlift =  Wing lift-drag ratio


         QLift  Rwing     Wing     Xwing
                           area
                           (m2)        (m)
U-2         23     10.6                        High-altitude spy plane
Albatros    20                       1.7       Largest bird
Gossamer    20             41.34    14.6       Gossamer albatross, human-powered aircraft
Airbus A380  7.5    7.5   845       36.3
Concorde     7.1          358.2     11.4
Boeing 747   7      7.9   525       29.3
Cessna 150   7             15        4.5
Wingsuit     2.5    1       2        1.0
QLift tends to be proportional to Rwing.


Wing drag force       =  Fdrag  =  Rearward force on the wing
Wing lift force       =  Flift  =  Upward lift force on the wing
Wing lift coefficient =  Qlift  =  Flift / Fdrag
The larger the value of Qlift the better. You can measure the
lift coefficient by measuring wing forces as above or you can measure the glide
ratio, discussed below.


Z = Glide ratio = Distance traveled / Initial height
The larger the glide ratio the better.
Z = Qlift


Maximum height of the helicopter = H
The larger the value of H the better.

Distance the plane flies = X
The larger the value of X the better.