

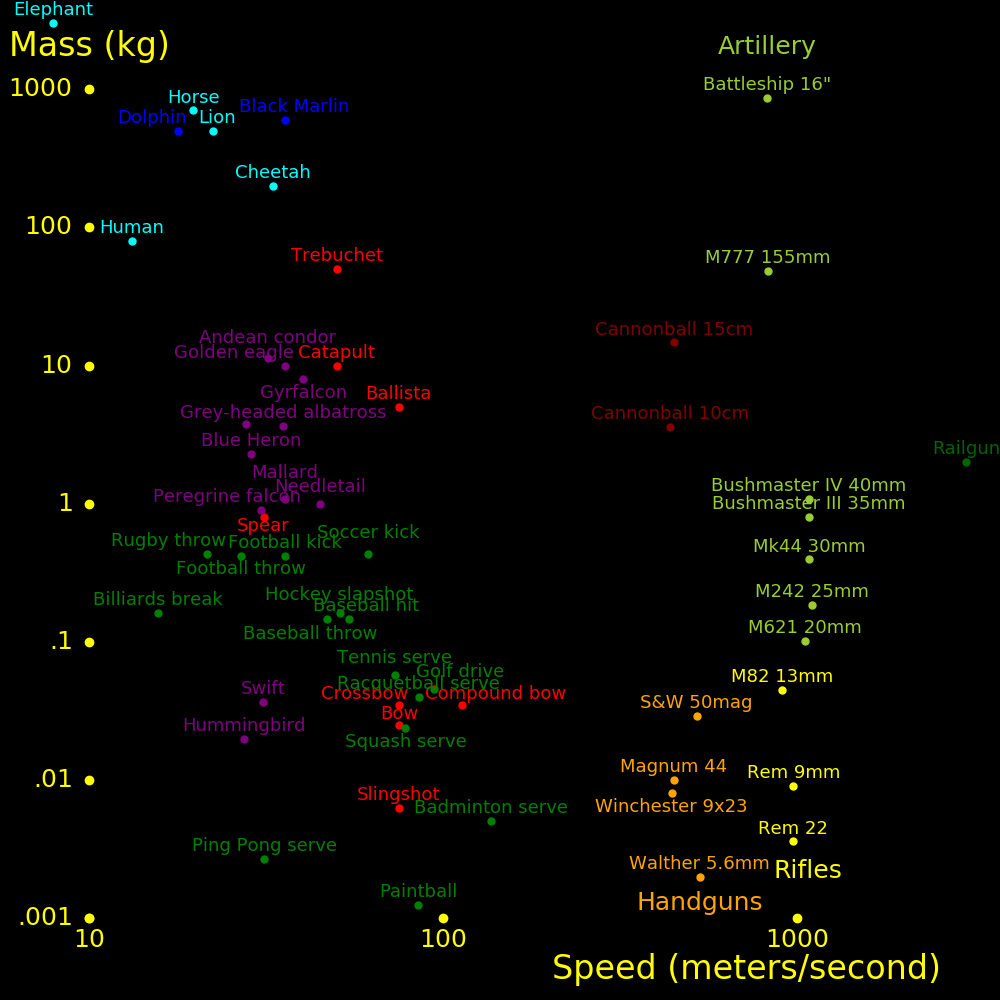
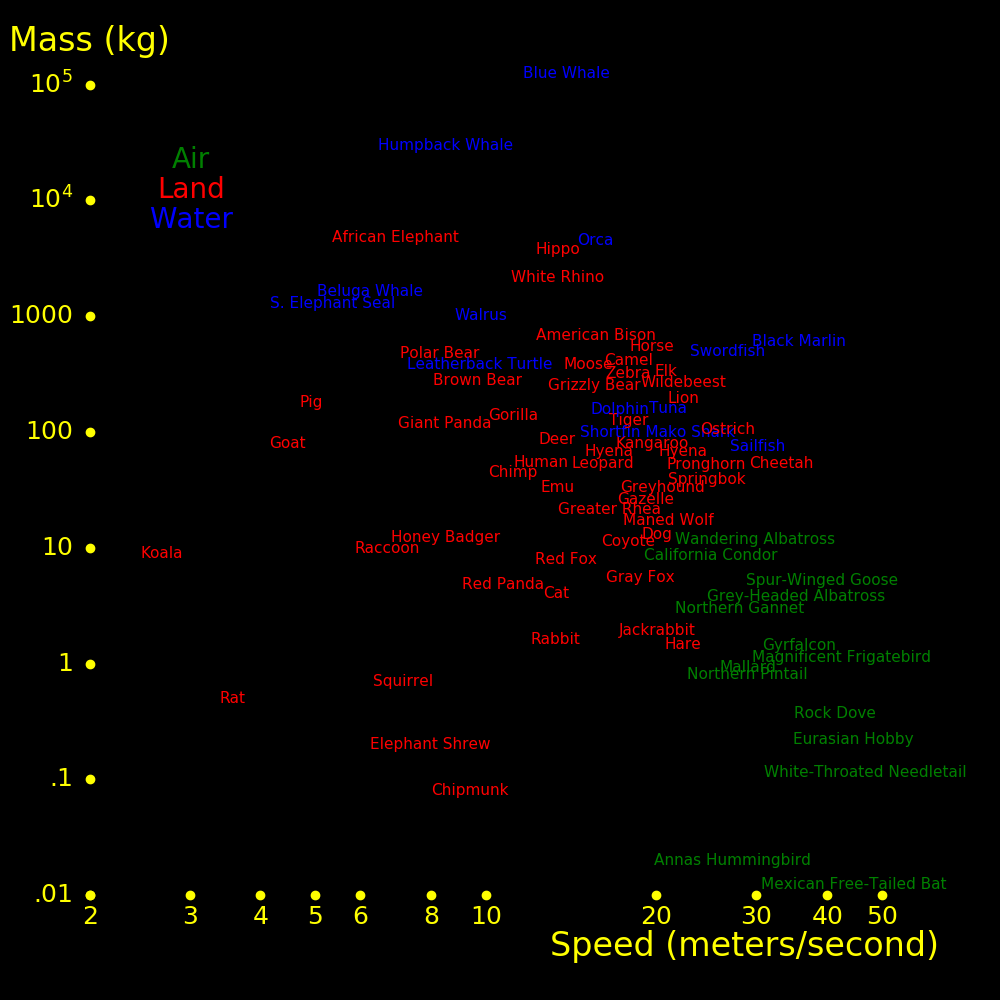
|
|
|
|
|
|
|---|---|---|---|---|---|
 |
 |
 |
 |
 |
 |
|---|---|---|---|---|---|
 |
 |
 |
 |
|---|---|---|---|
 |
 |
 |
 |
|
|---|---|---|---|---|
 |
 |
 |
 |
|
|---|---|---|---|---|
 |
 |
|---|---|
 |
|---|
 |
|---|
 |
|---|
 |
|---|
 |
|---|
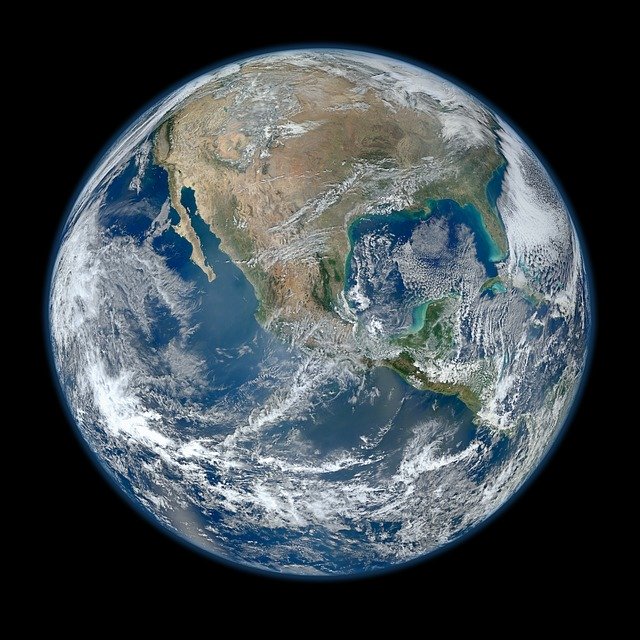
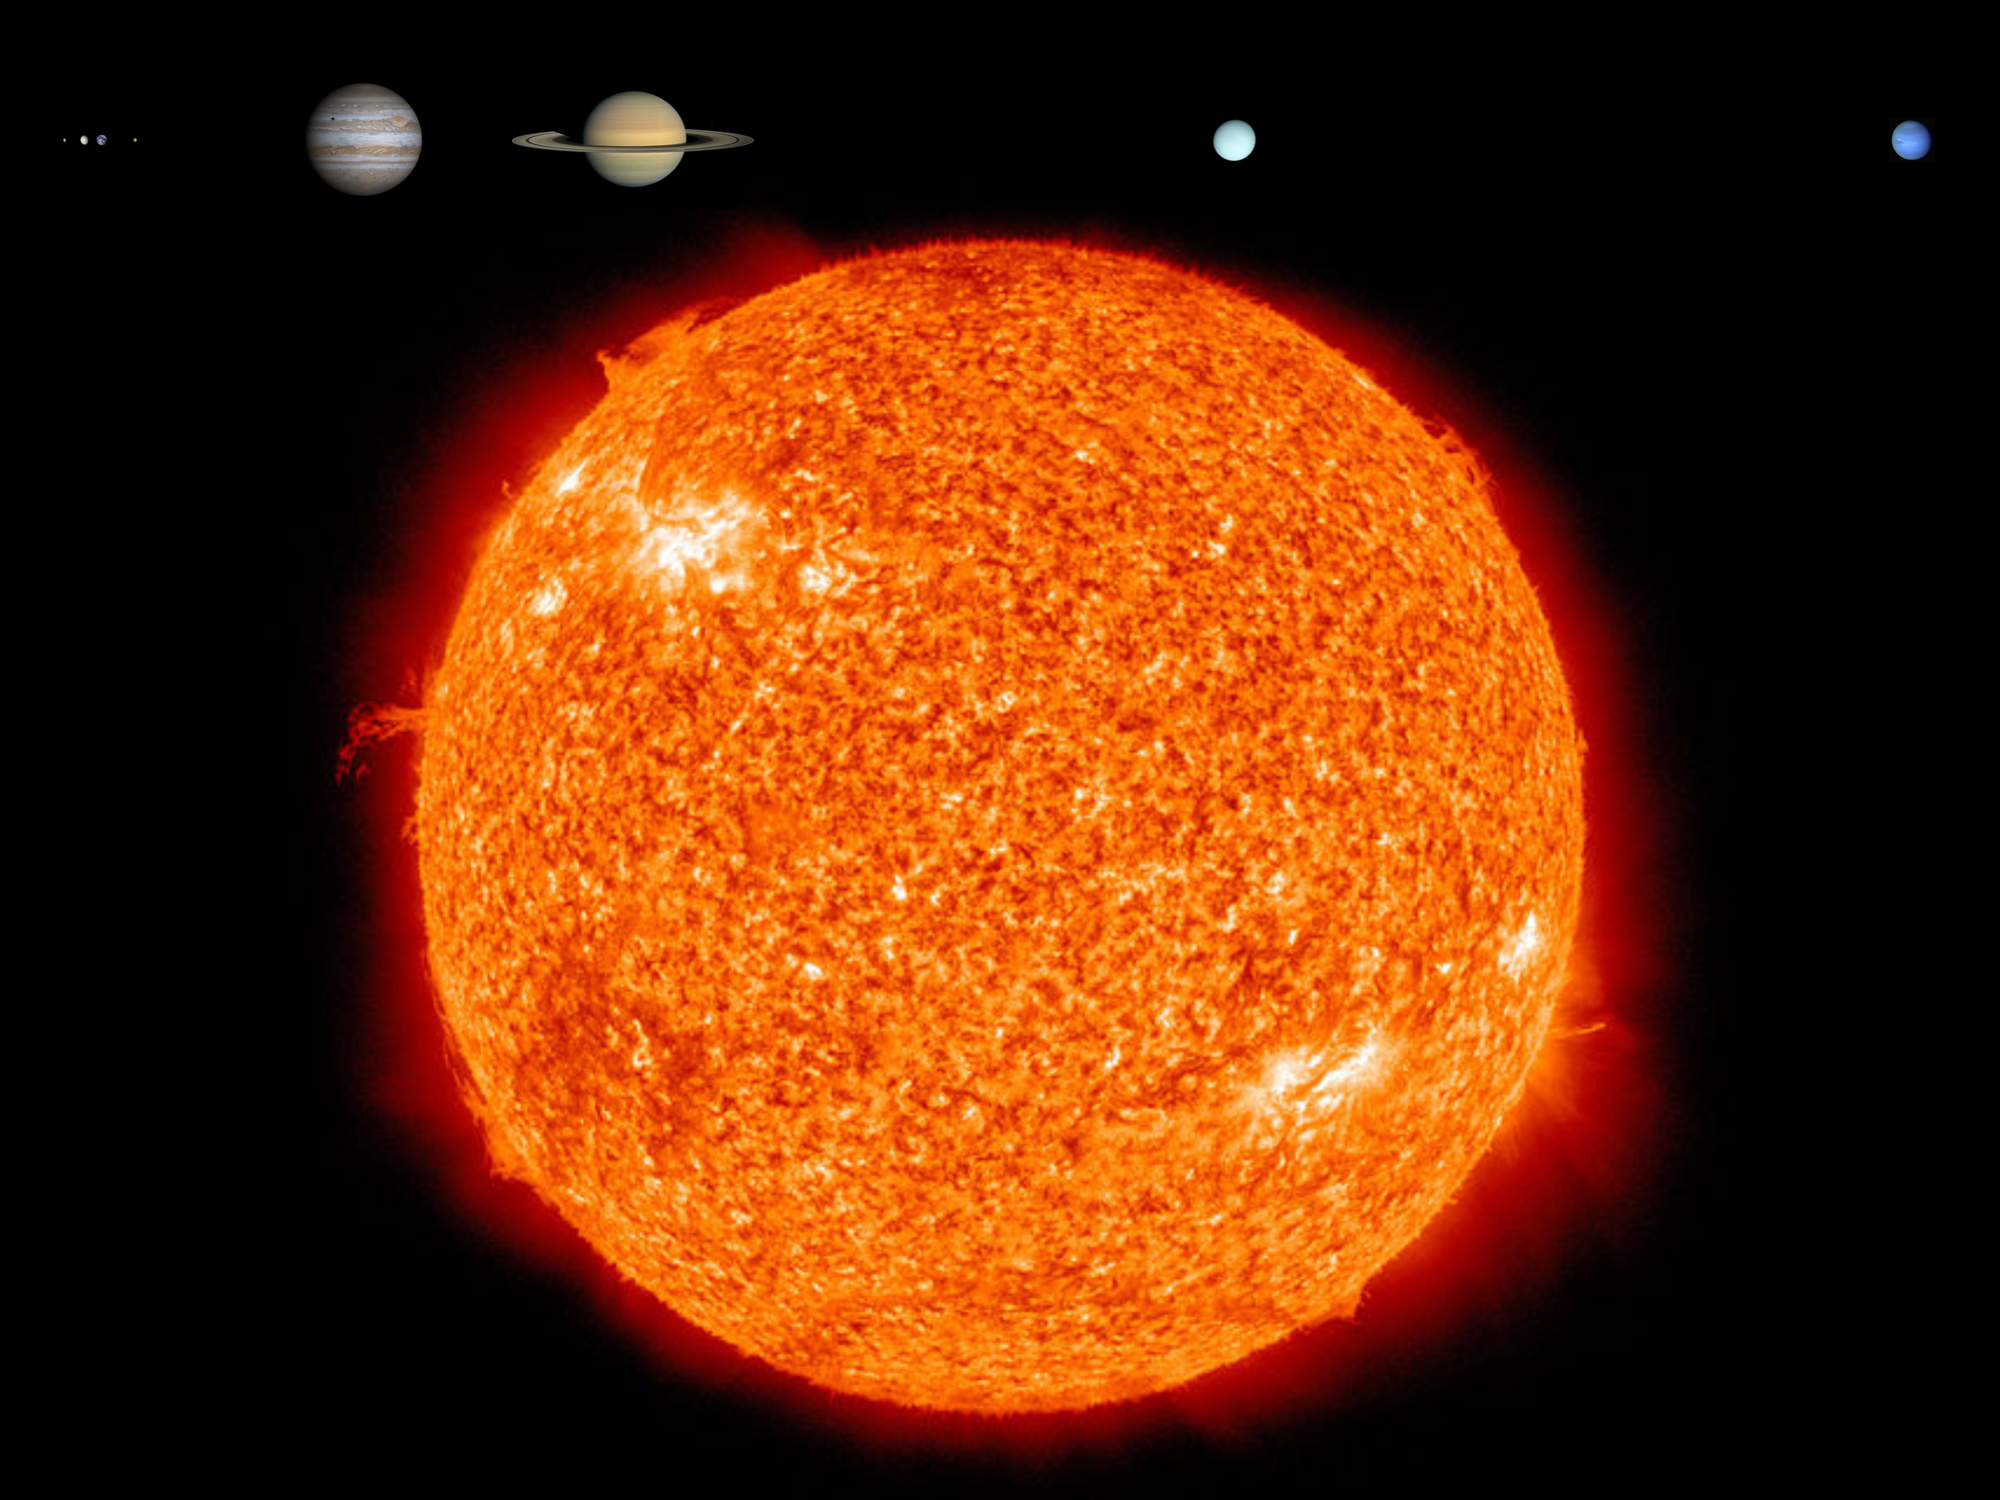
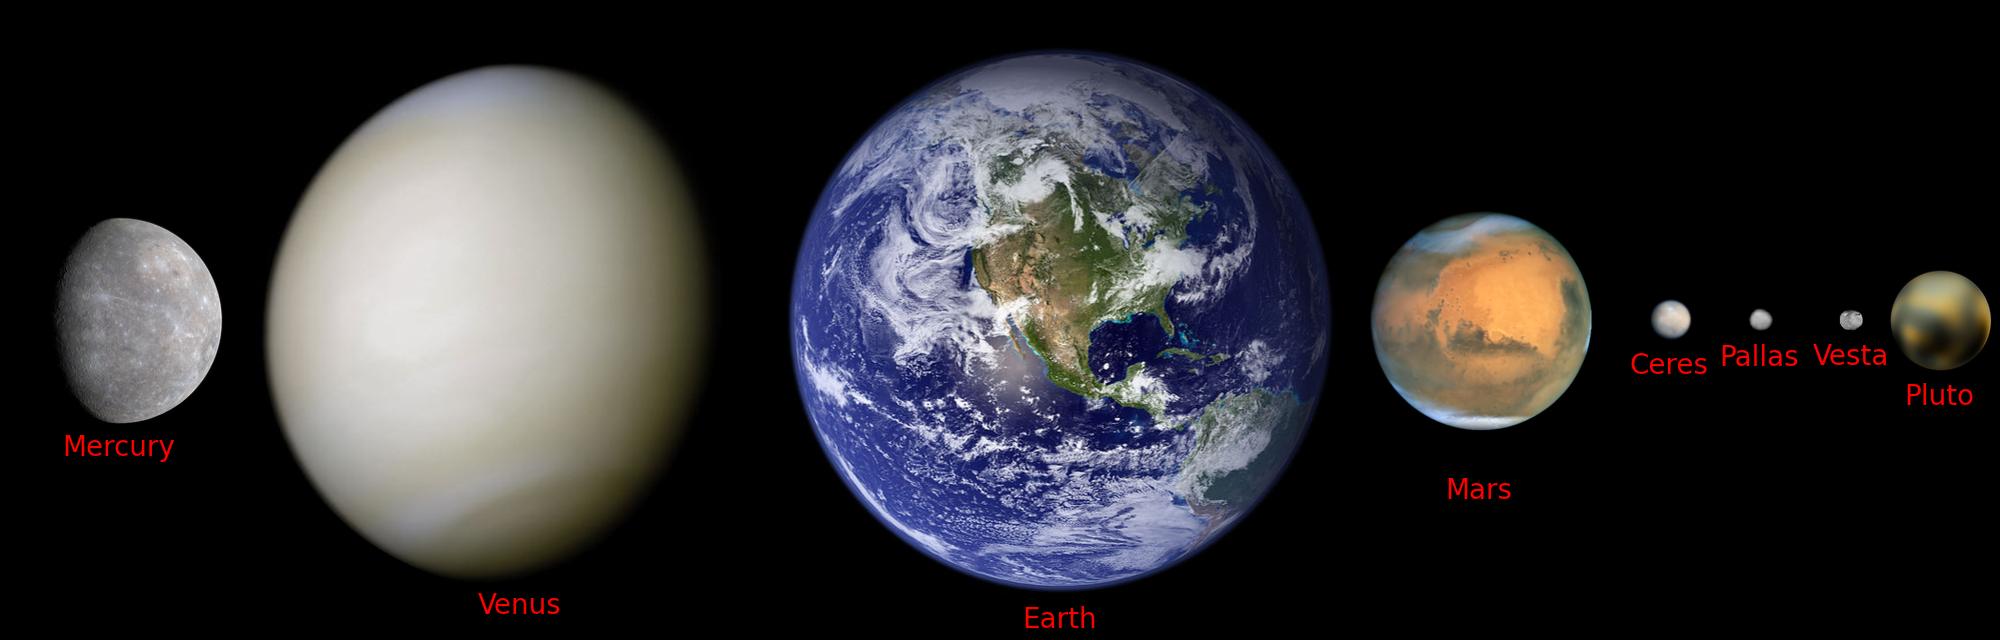
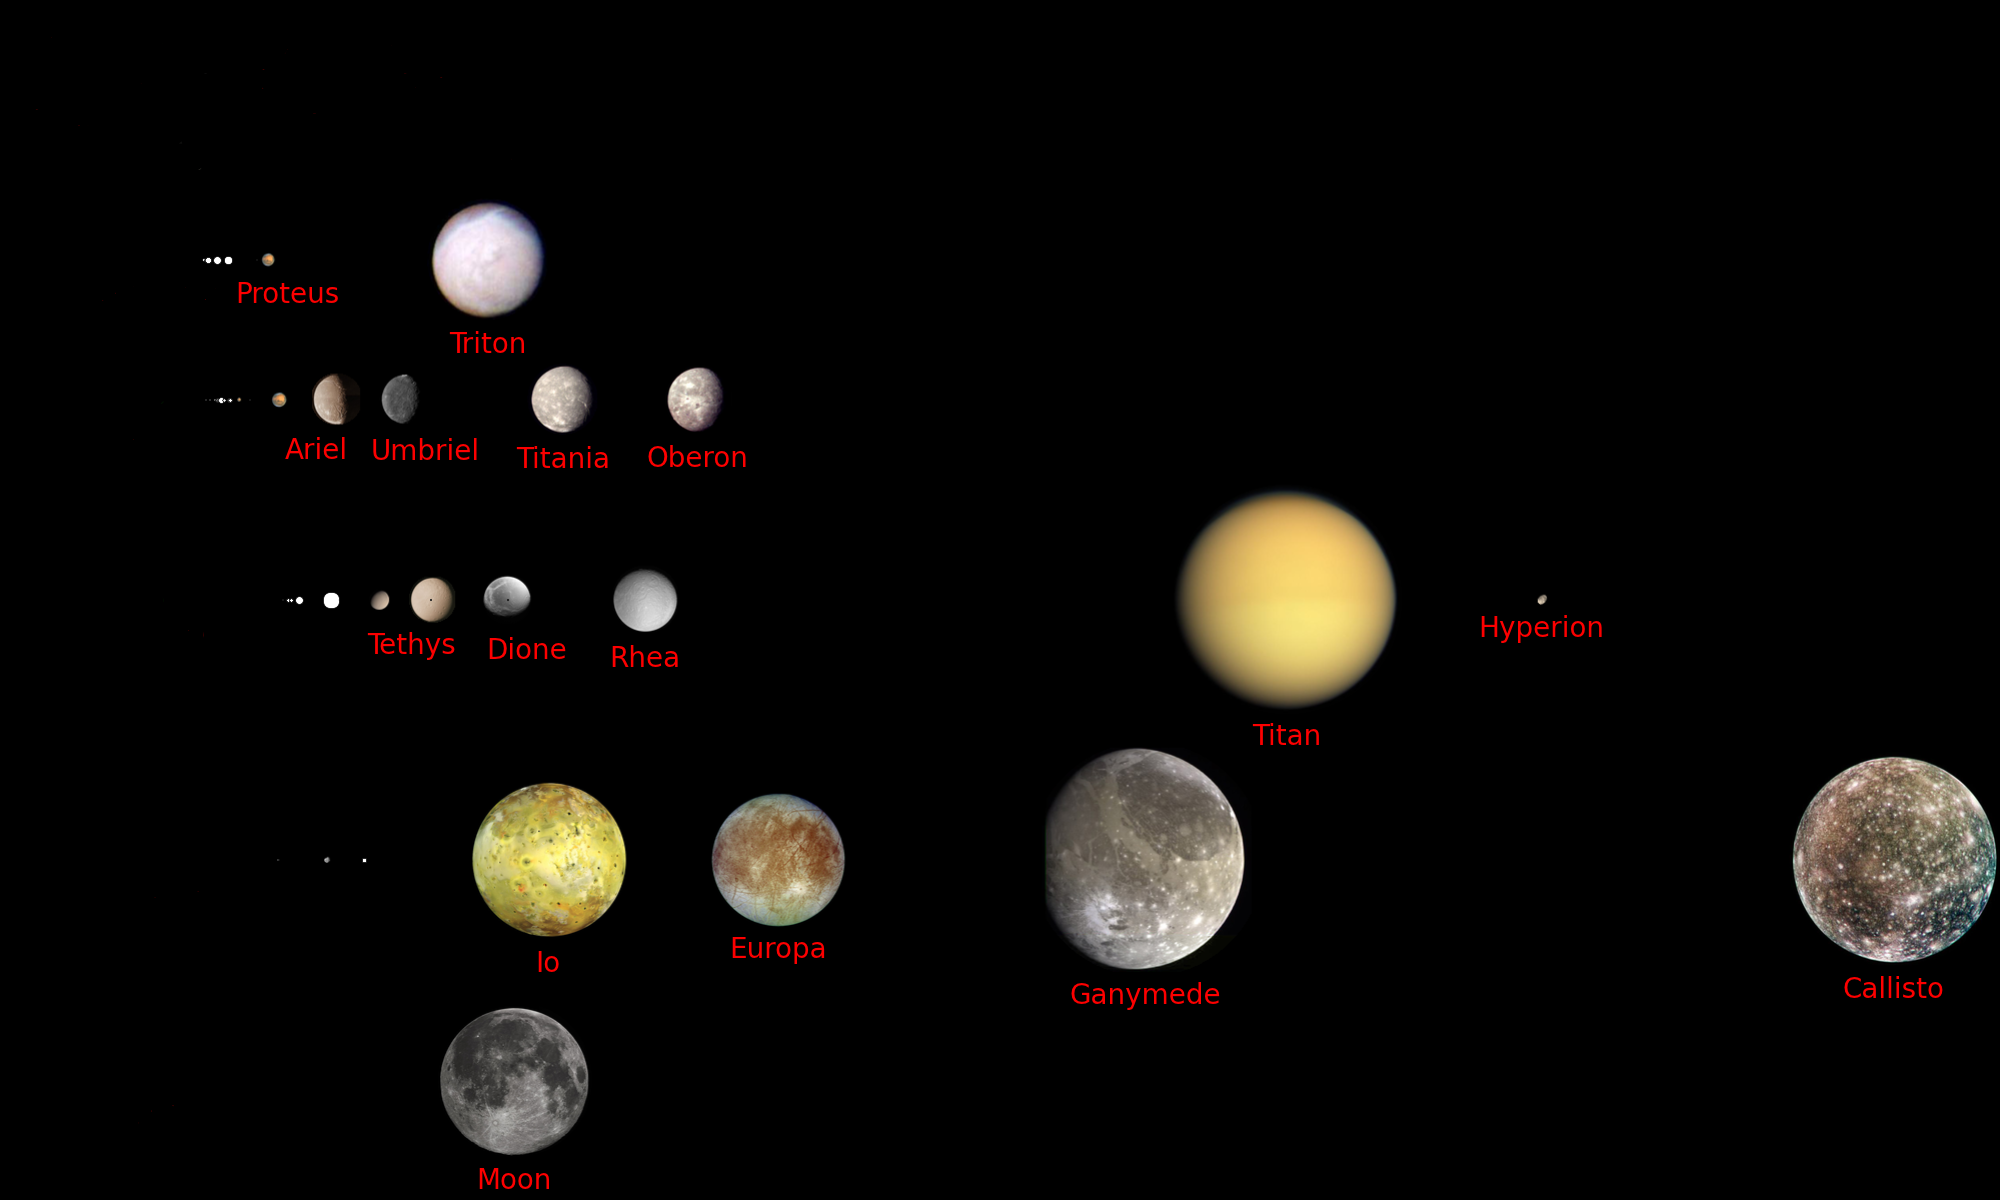
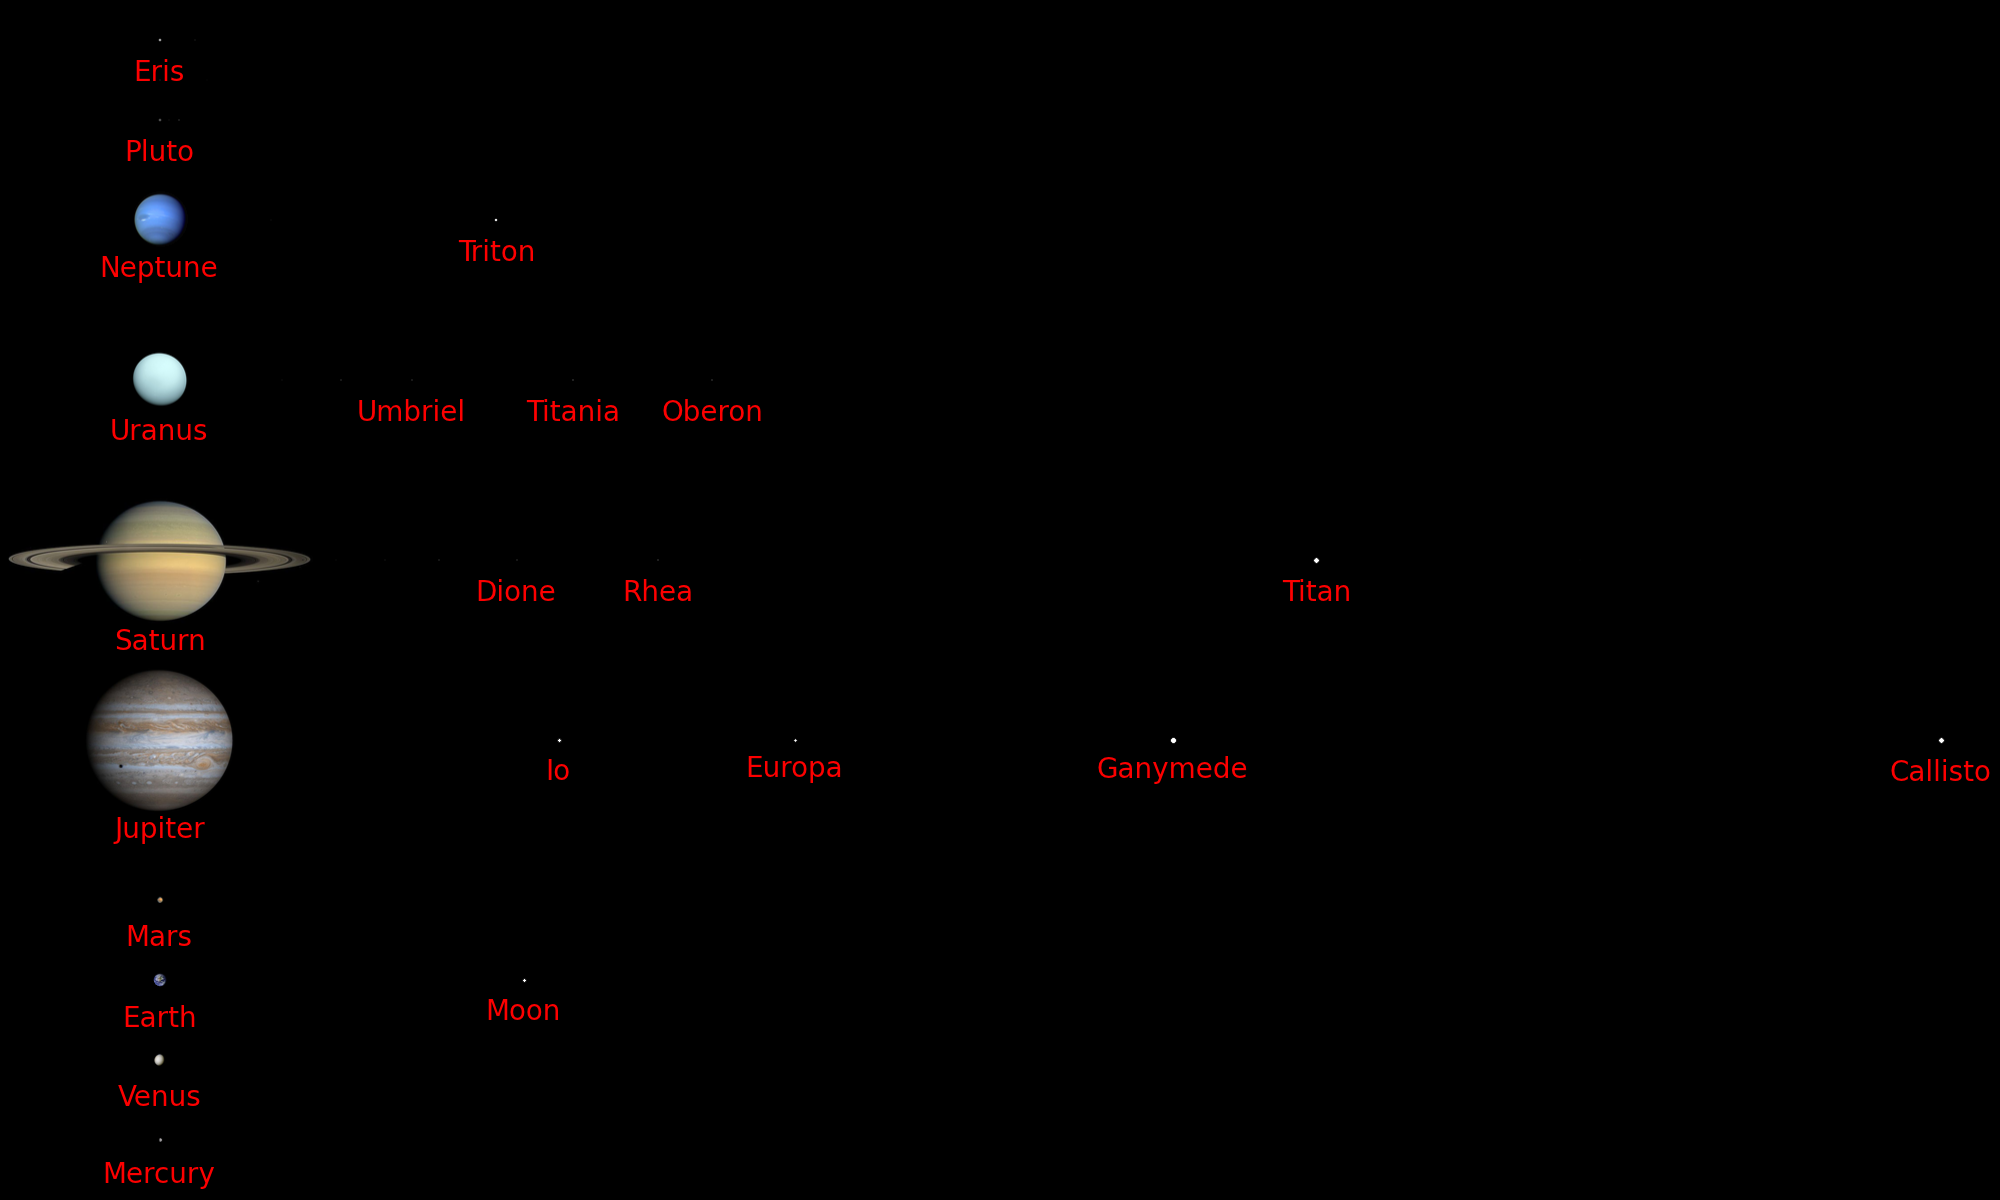
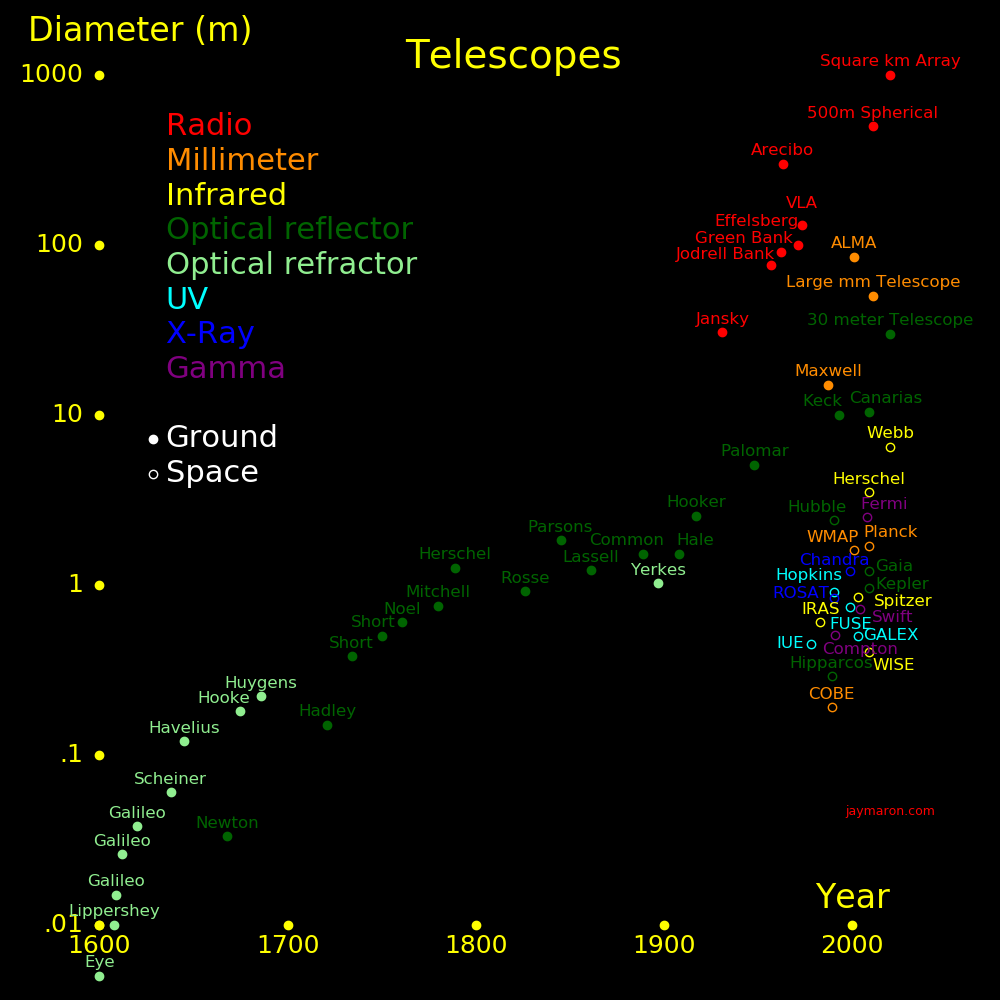
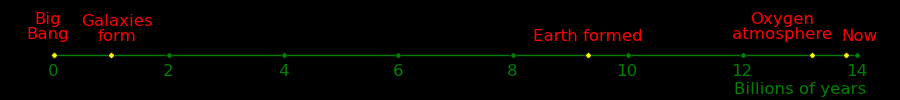
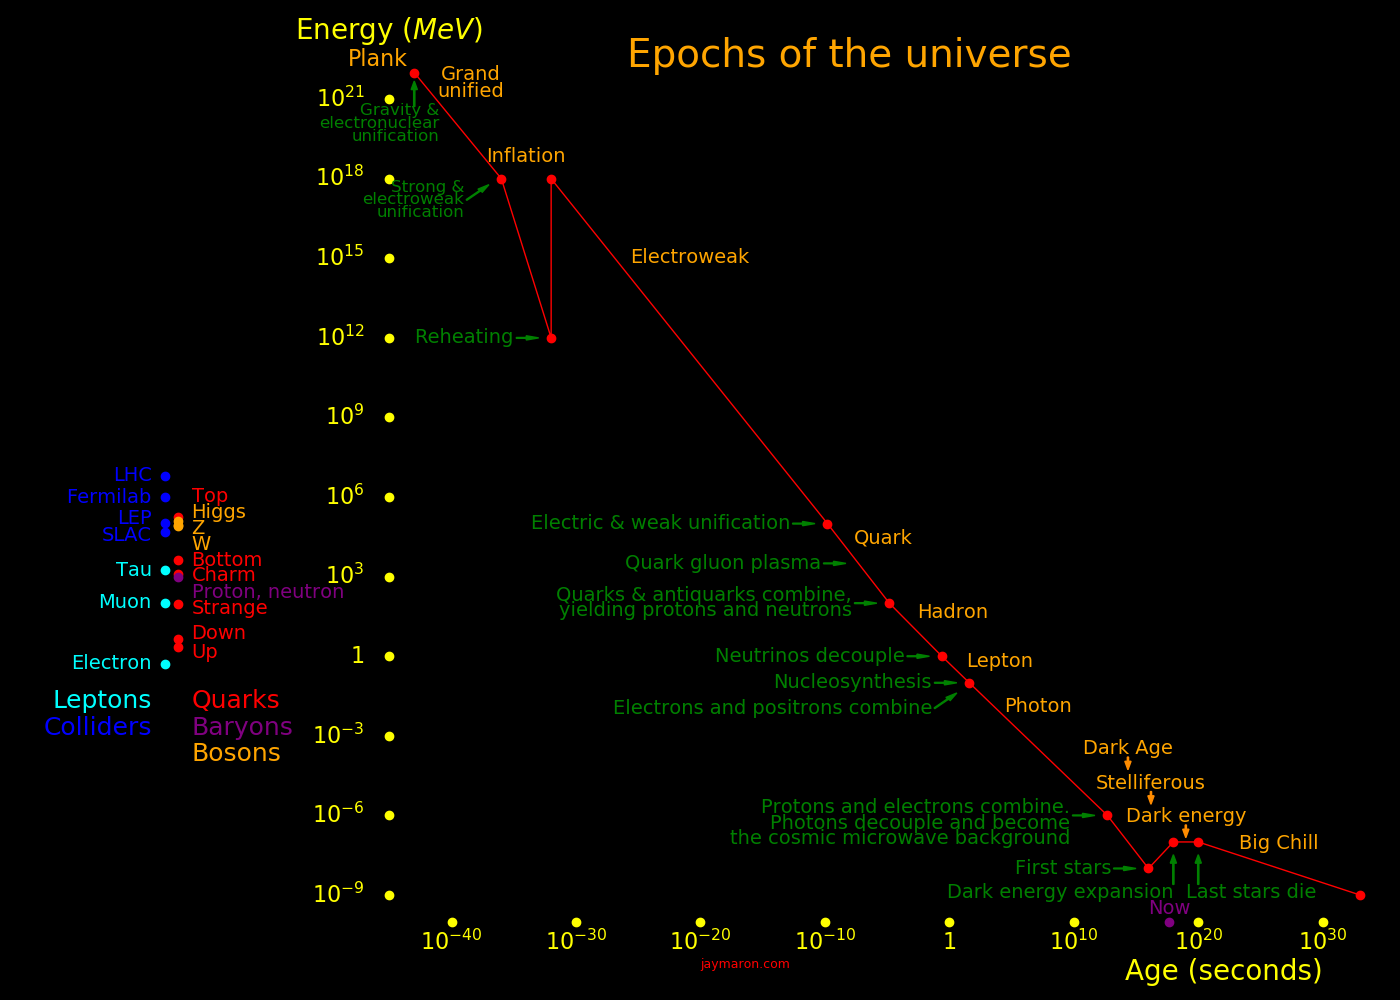
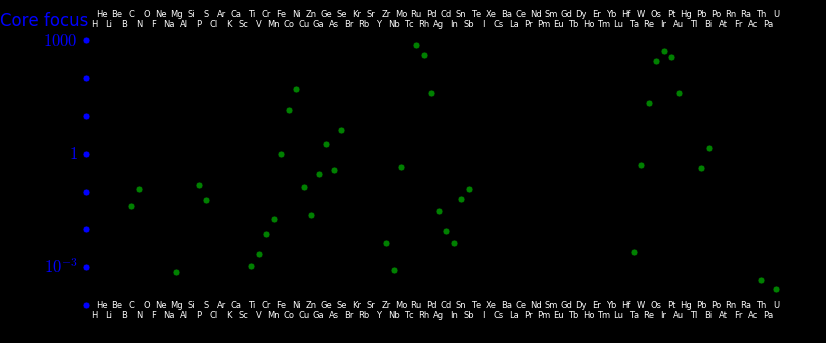
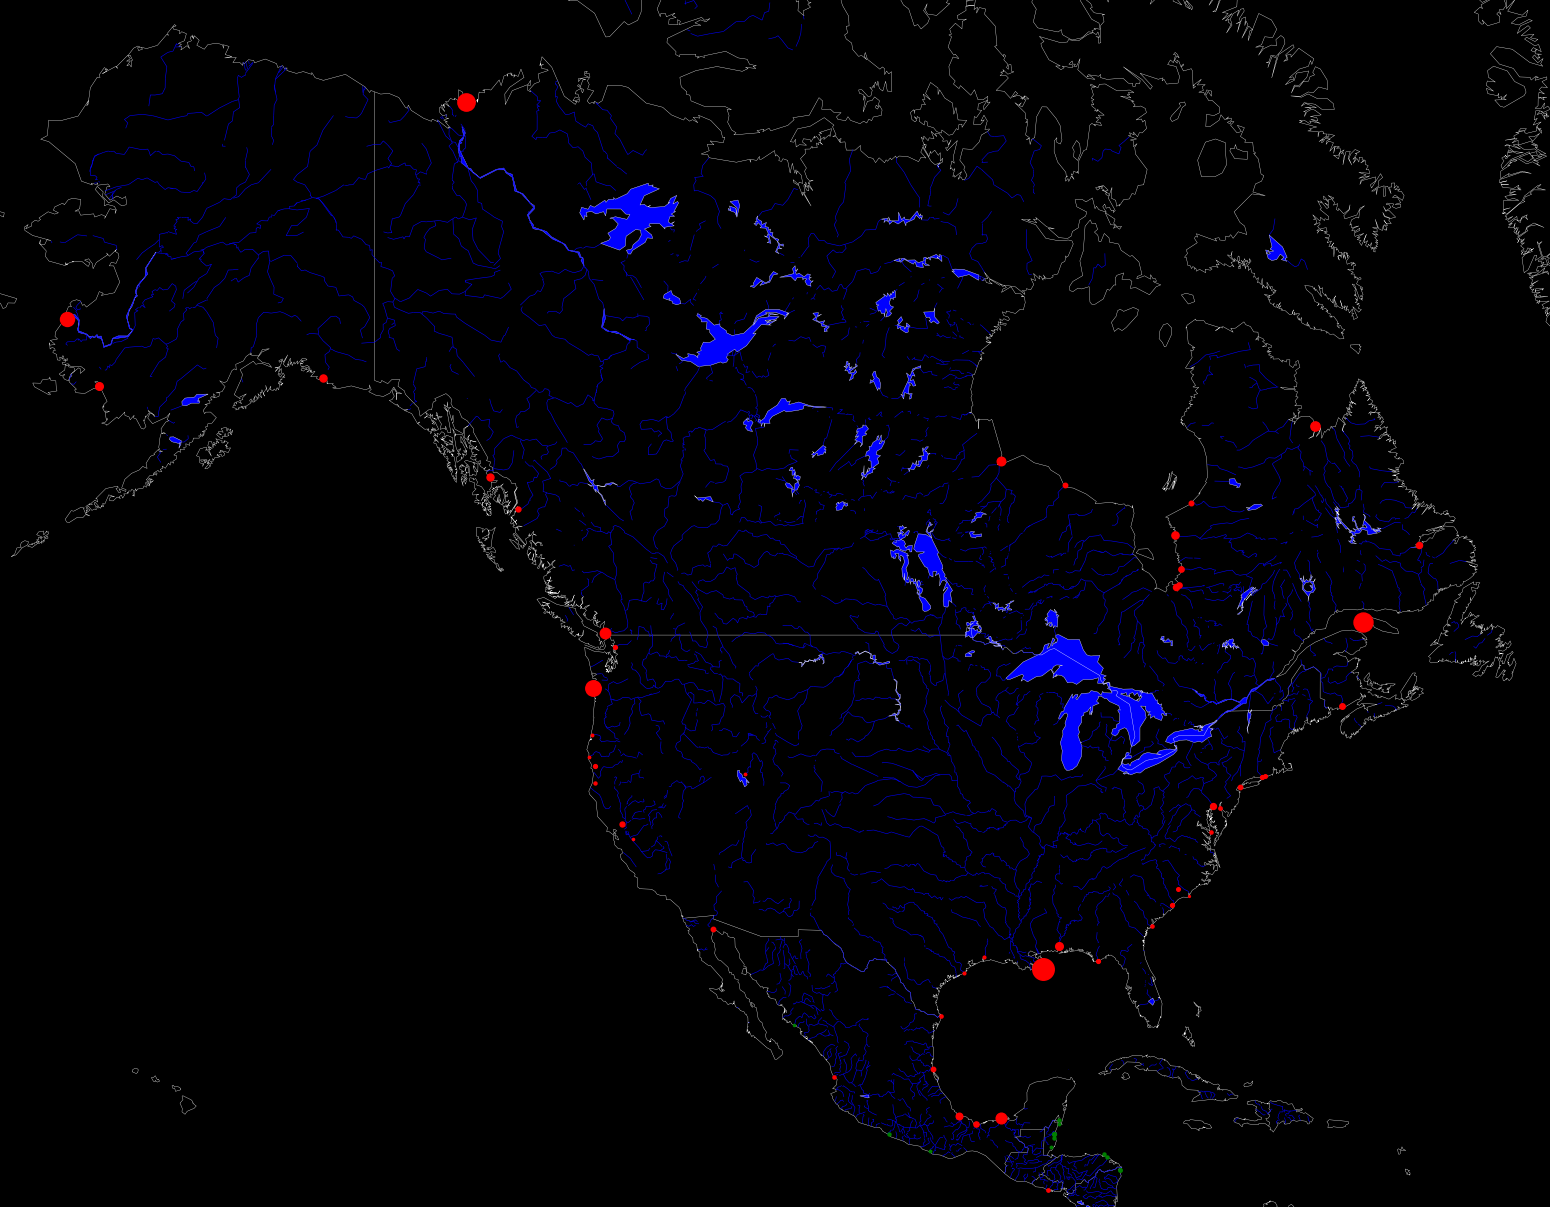
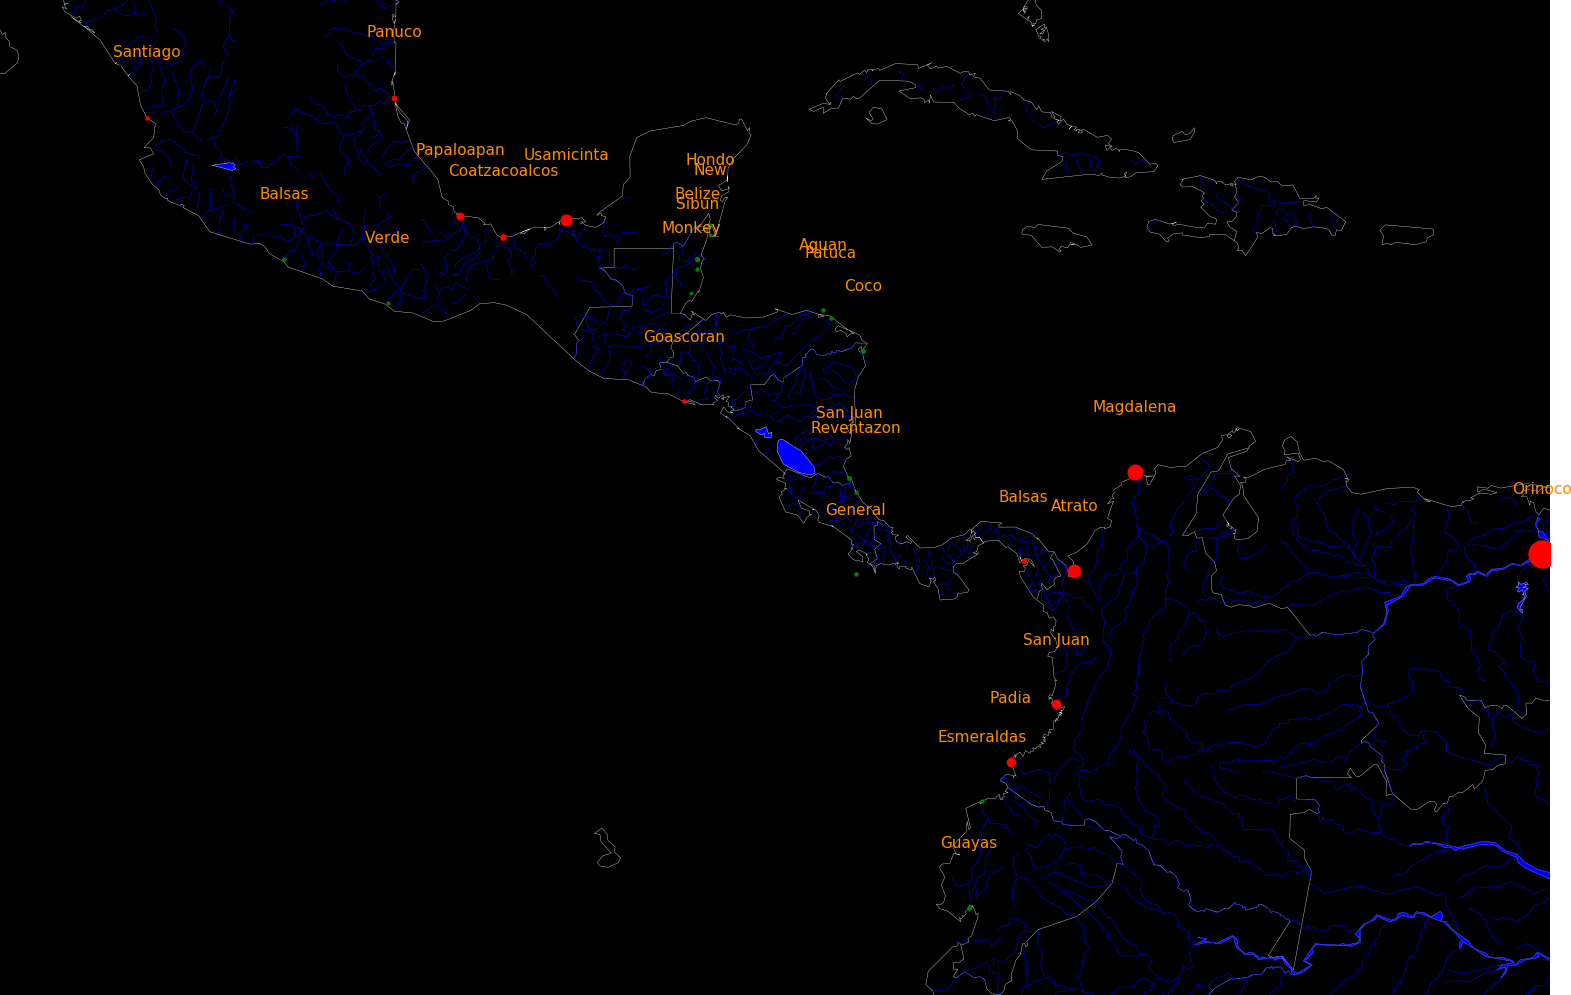
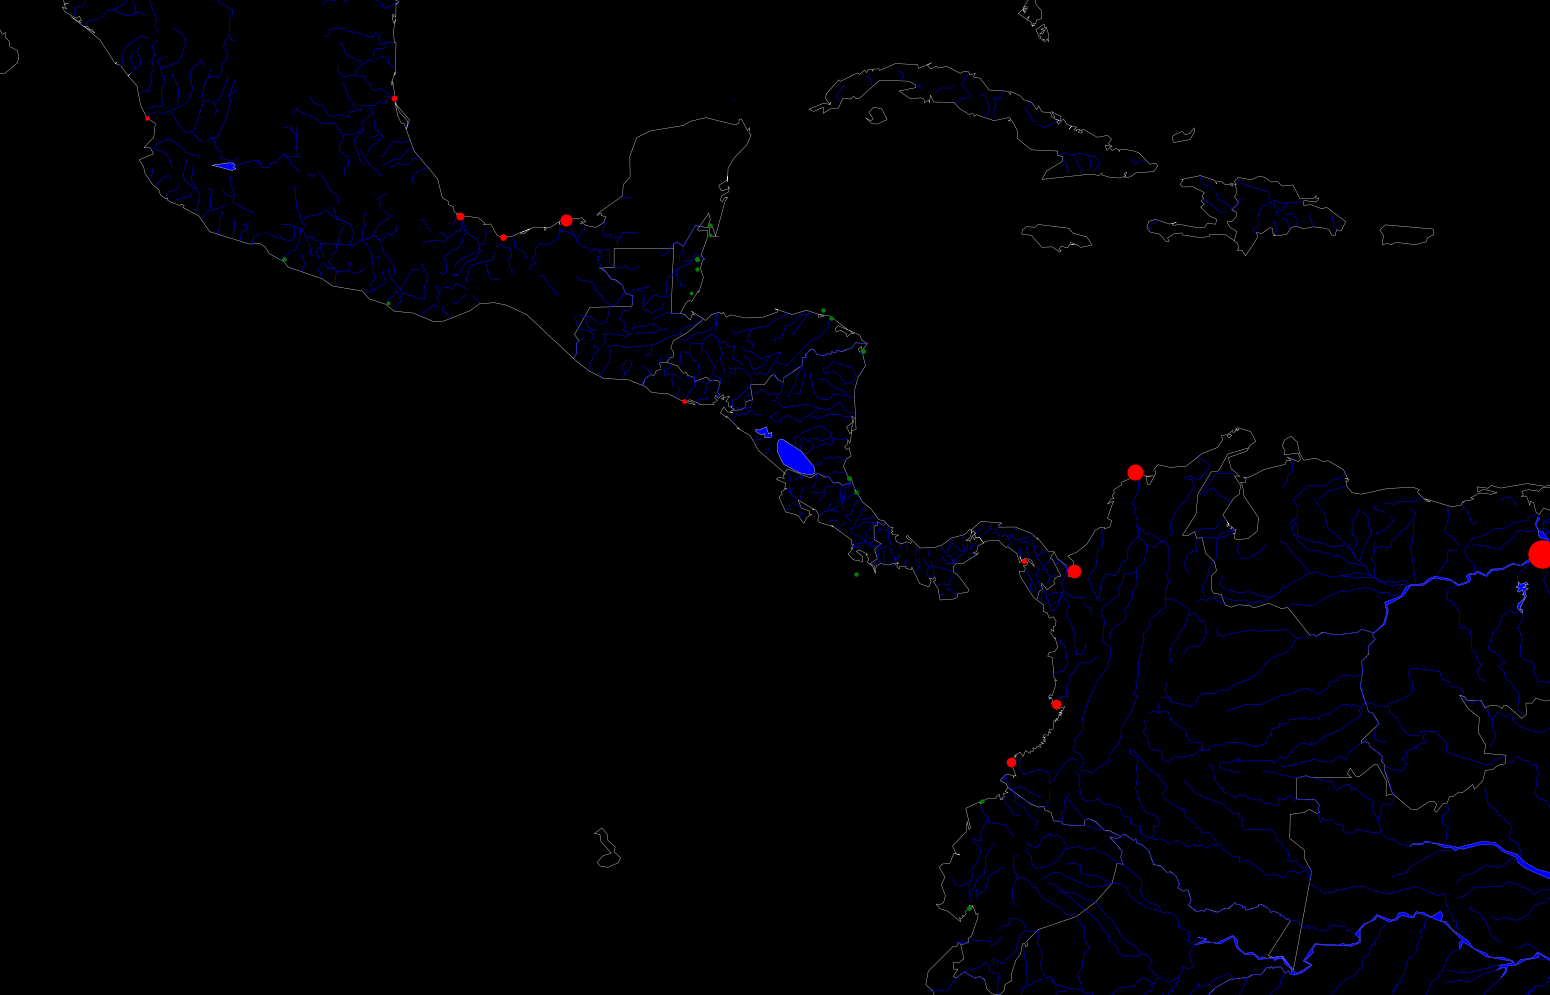
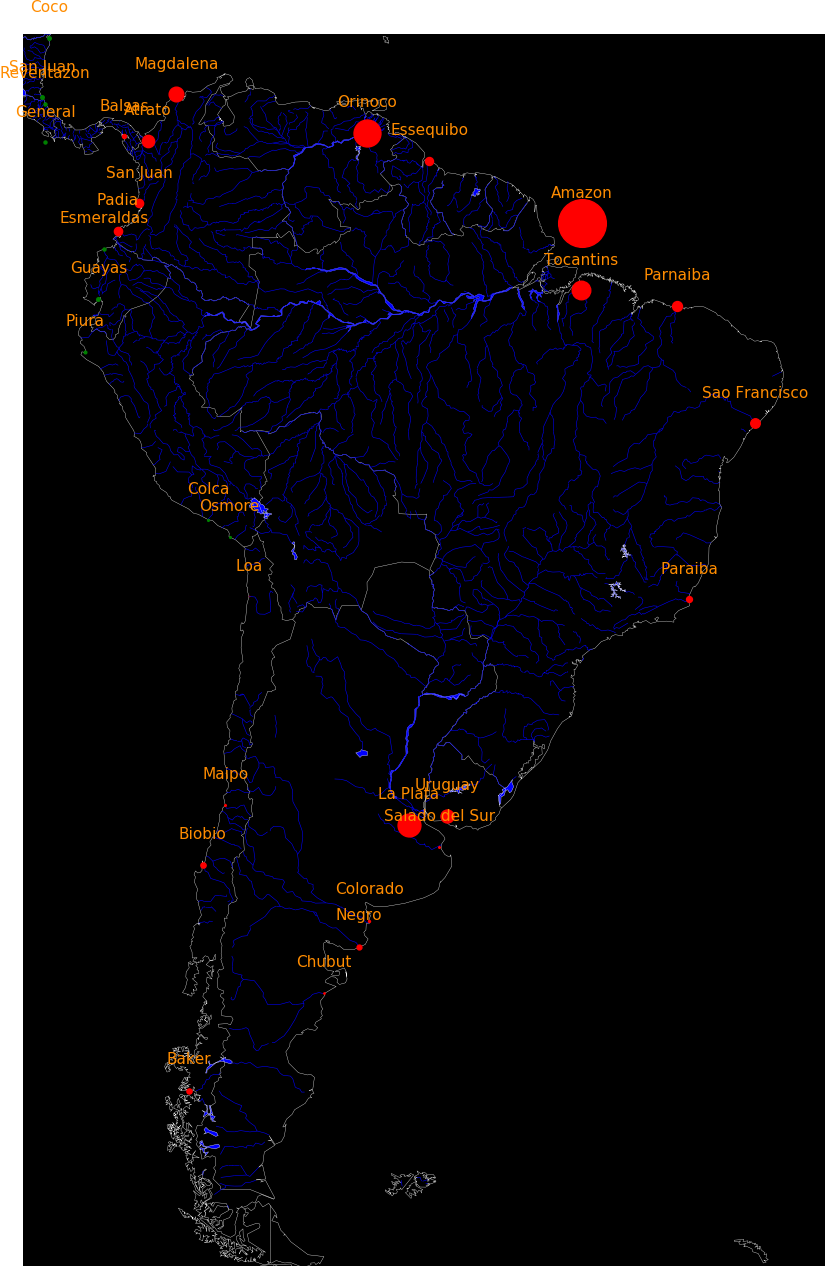
Continue to the rest of the "scales of the universe exhibit"
 |
|---|
 |
|---|
 |
|---|
 |
|---|
 |
|---|
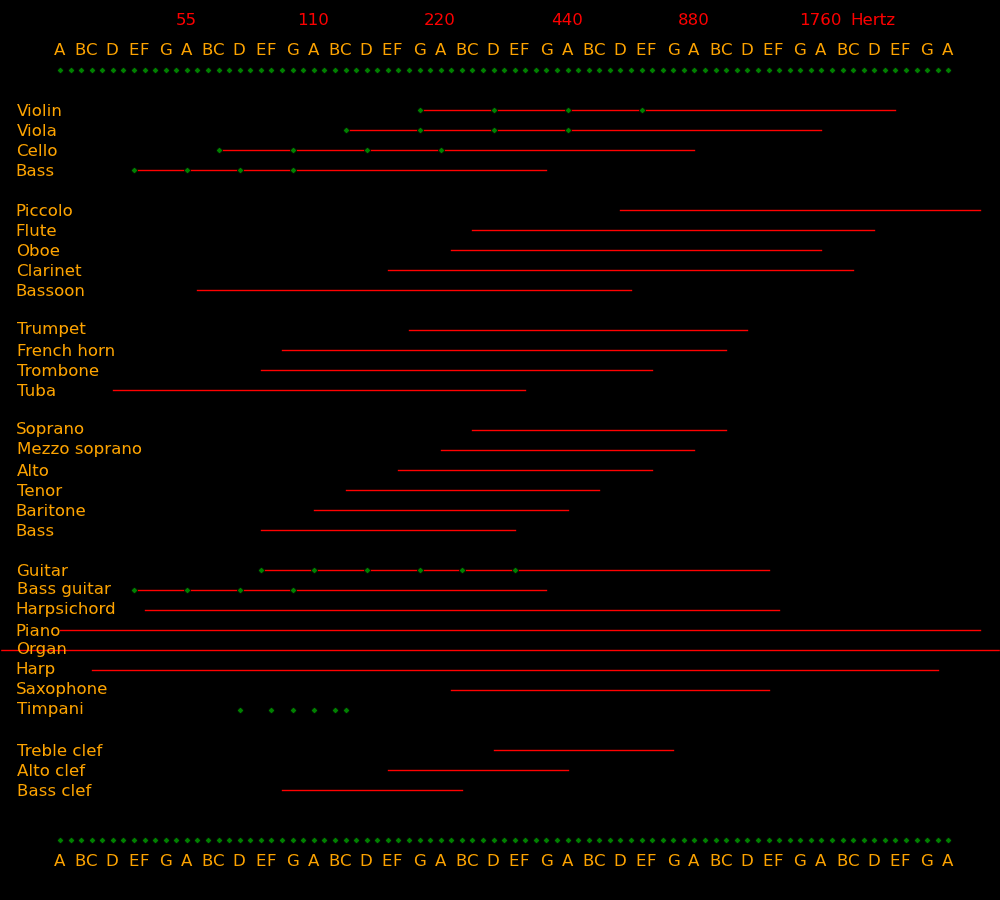
Green dots are open strings.
 |
|---|
 |
|---|
 |
|---|
 |
|---|
 |
|---|
 |
|---|
 |
|---|
 |
|---|
 |
|---|
 |
|---|
 |
|---|
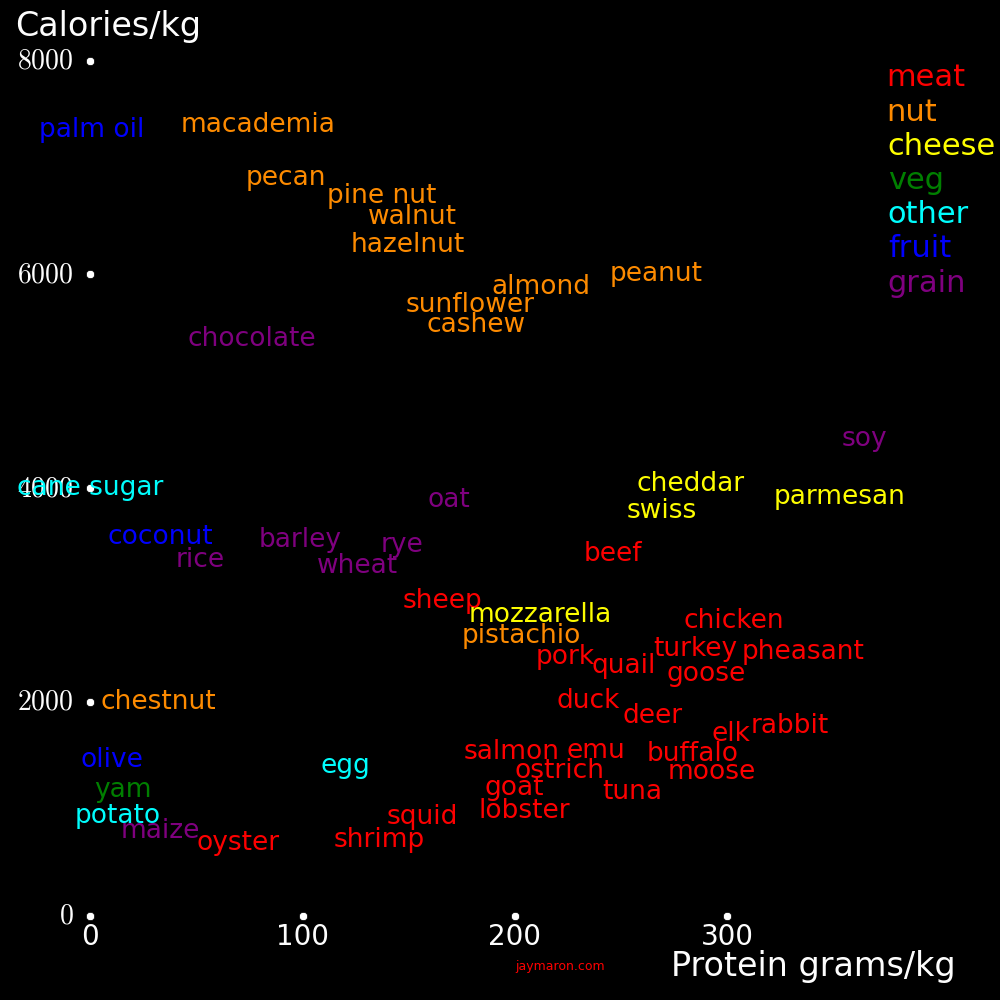
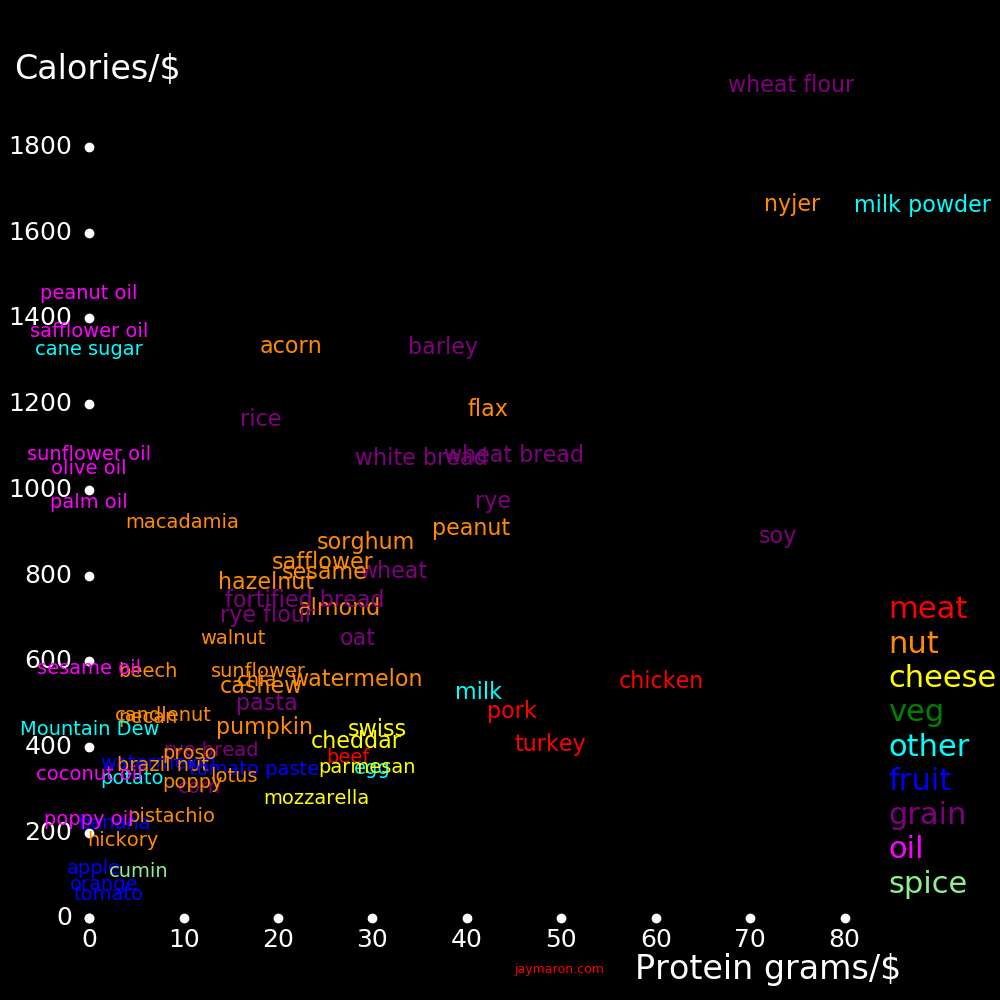
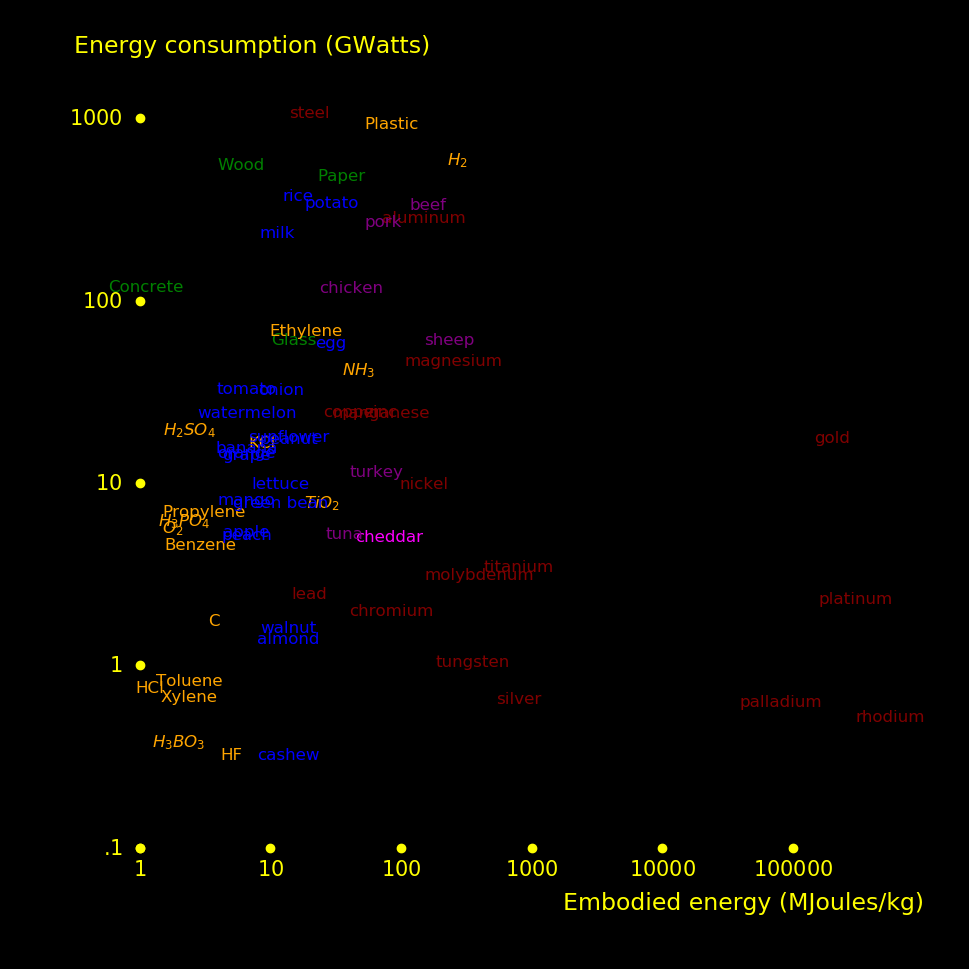
The left plot shows the protein and calorie content of food. Foods with high protein and low fat are in the lower right. Nuts are heavy in protein, especially peanuts.
The right plot shows how much calories and protein you get per dollar. The cheapest meats are pork, chicken, and turkey.
 |
 |
|---|---|
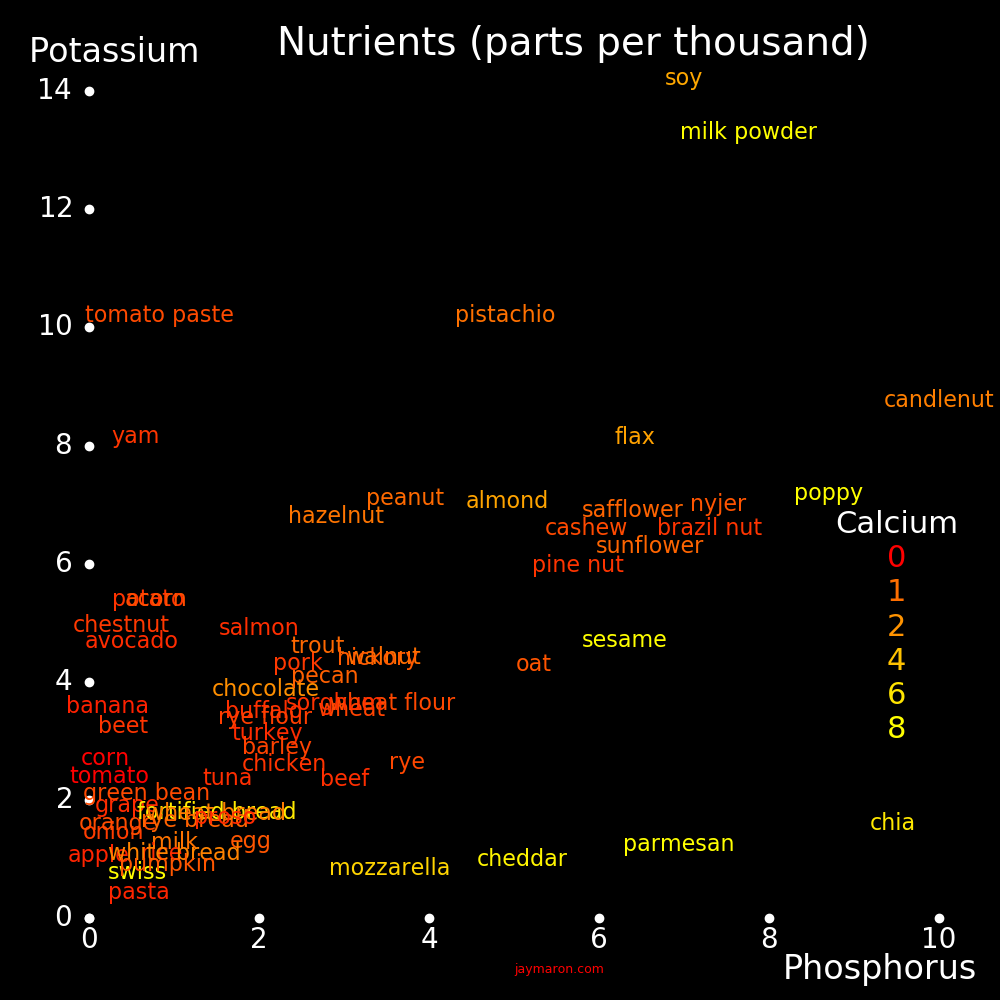
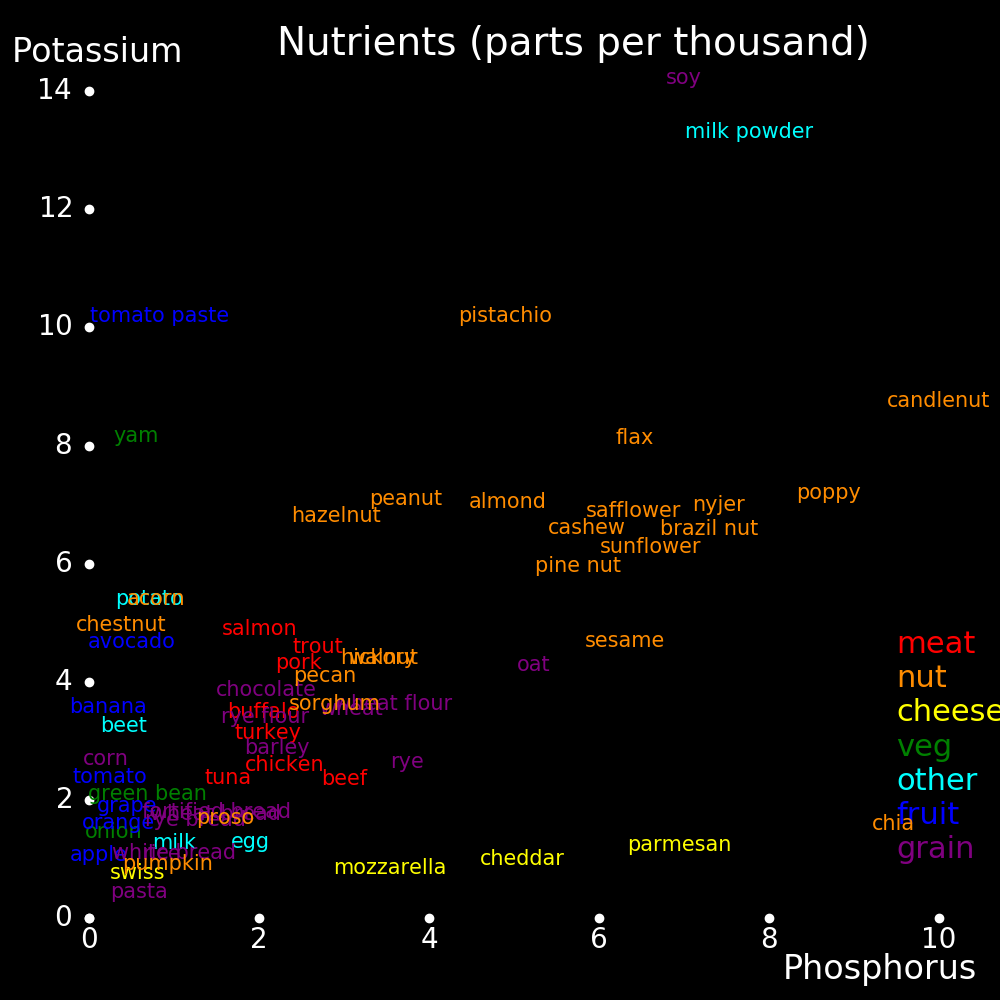
The plot shows the potassium, phosphorus, and calcium content of food. Calcium is abundant in cheese and milk and rare in other foods. Sesame is rich in calcium.
 |
|---|
 |
 |
|---|---|
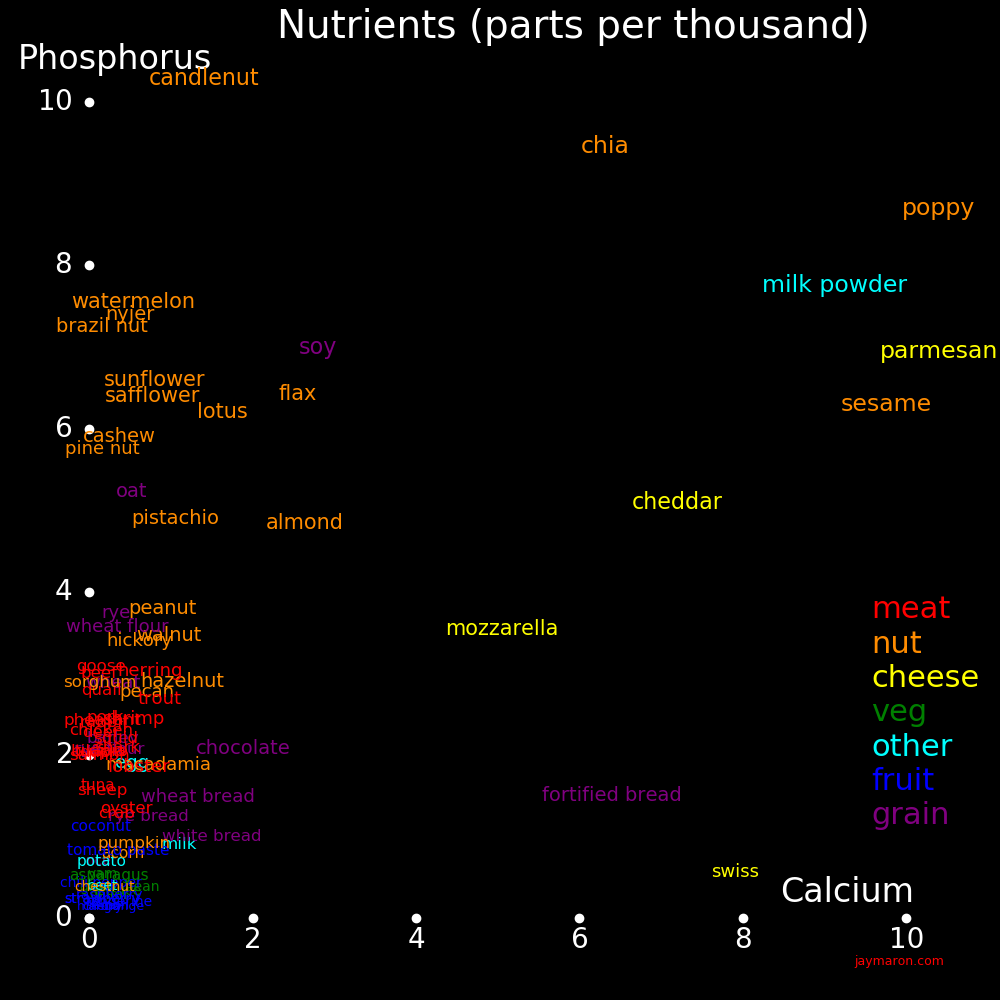
The plot shows the phosphorus and potassium content of food. Most nuts are rich in these elements.
 |
|---|
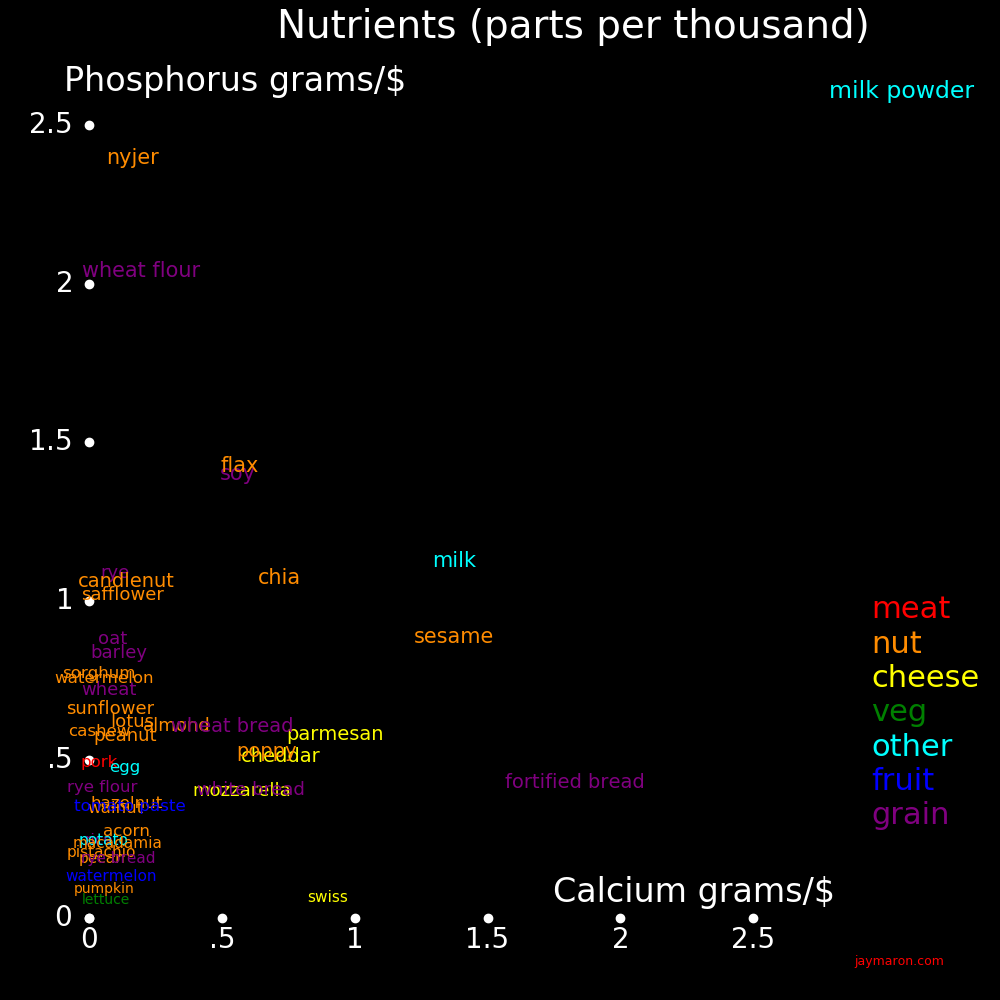
For bird seed, what matters is calories and calcium, and the best seeds are sesame and nyger.
 |
|---|
 |
|---|
 |
|---|
 |
|---|
 |
|---|
 |
|---|
 |
|---|
 |
|---|
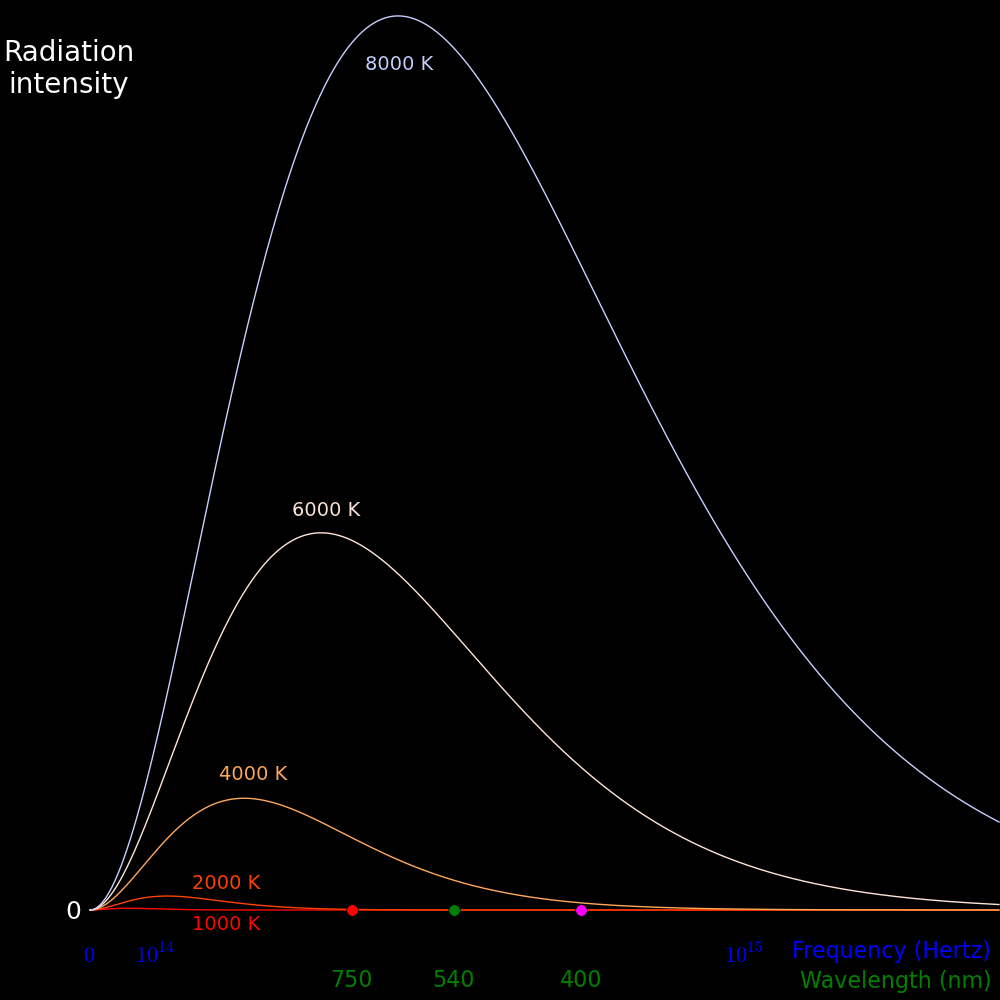
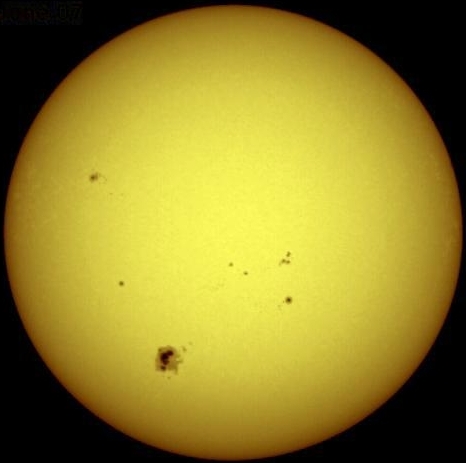
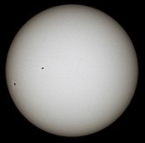
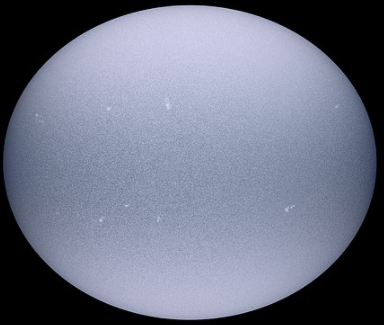
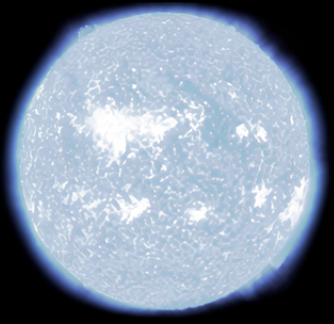
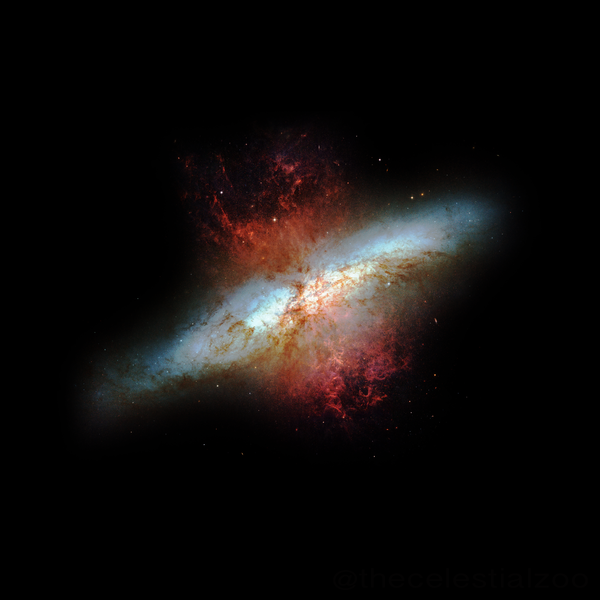
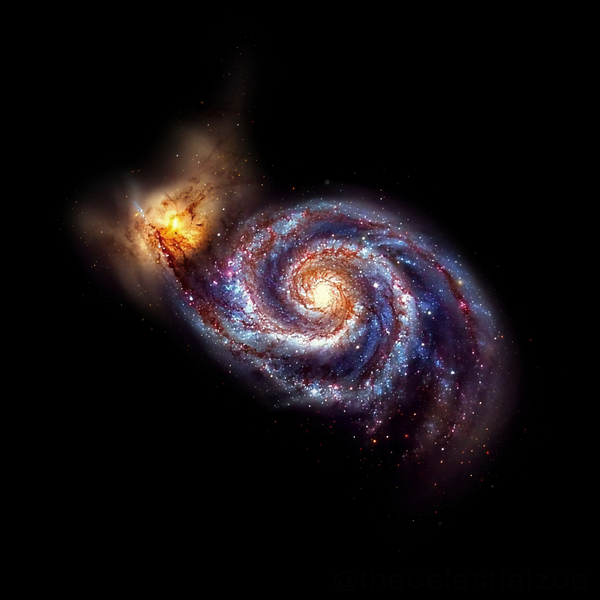
Color is as your eye would see.
 |
|---|
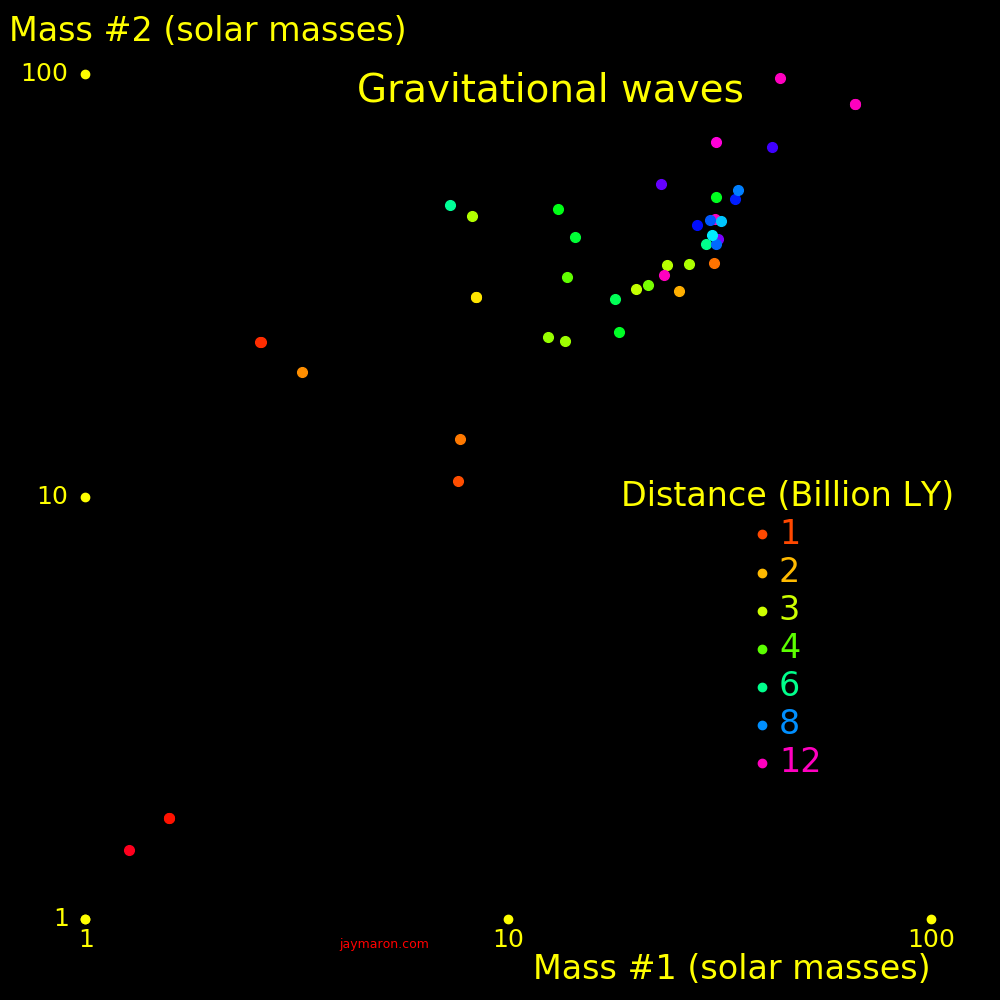
LIGO gravitational wave events.
 |
|---|
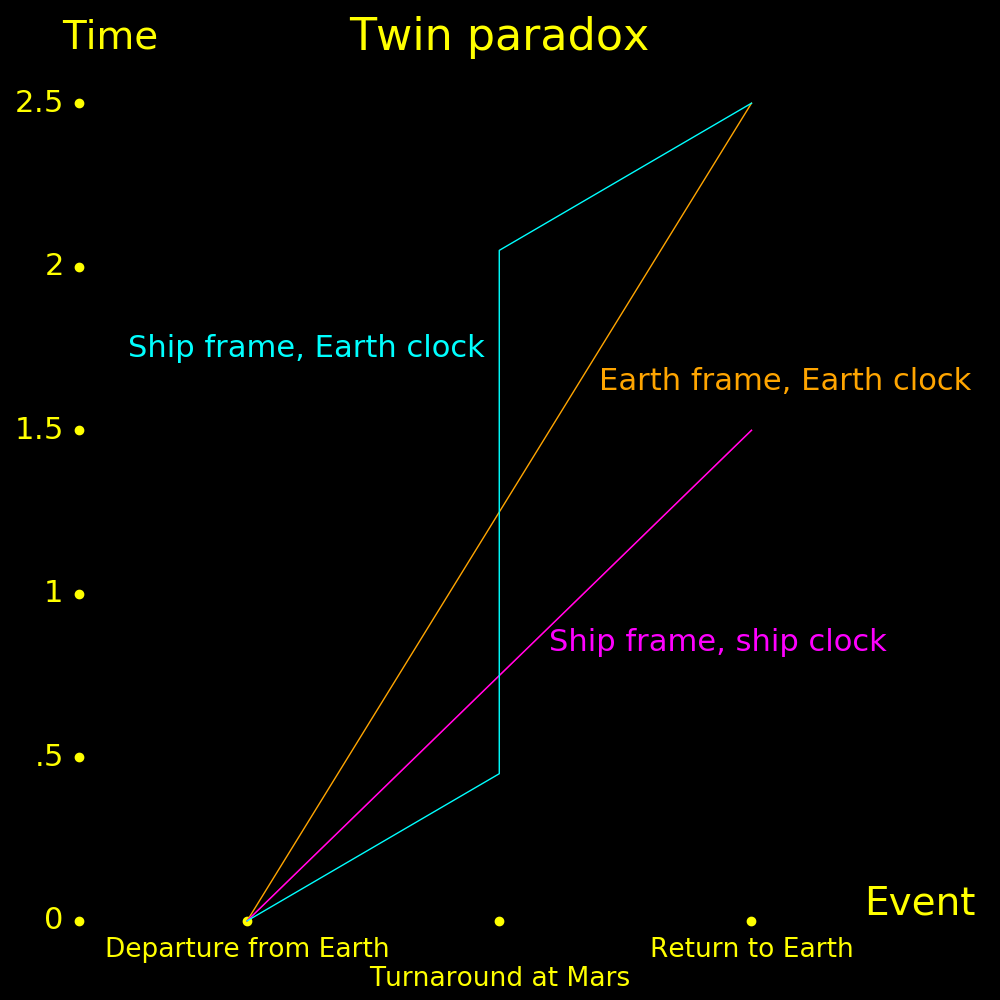
Twin paradox. Suppose a ship travels from Earth to Mars and back.
 |
|---|
 |
|---|
 |
|---|
 |
|---|
 |
|---|
 |
|---|
 |
|---|
 |
|---|
 |
|---|
 |
|---|
 |
|---|
 |
|---|
 |
|---|
 |
|---|
 |
|---|
 |
|---|
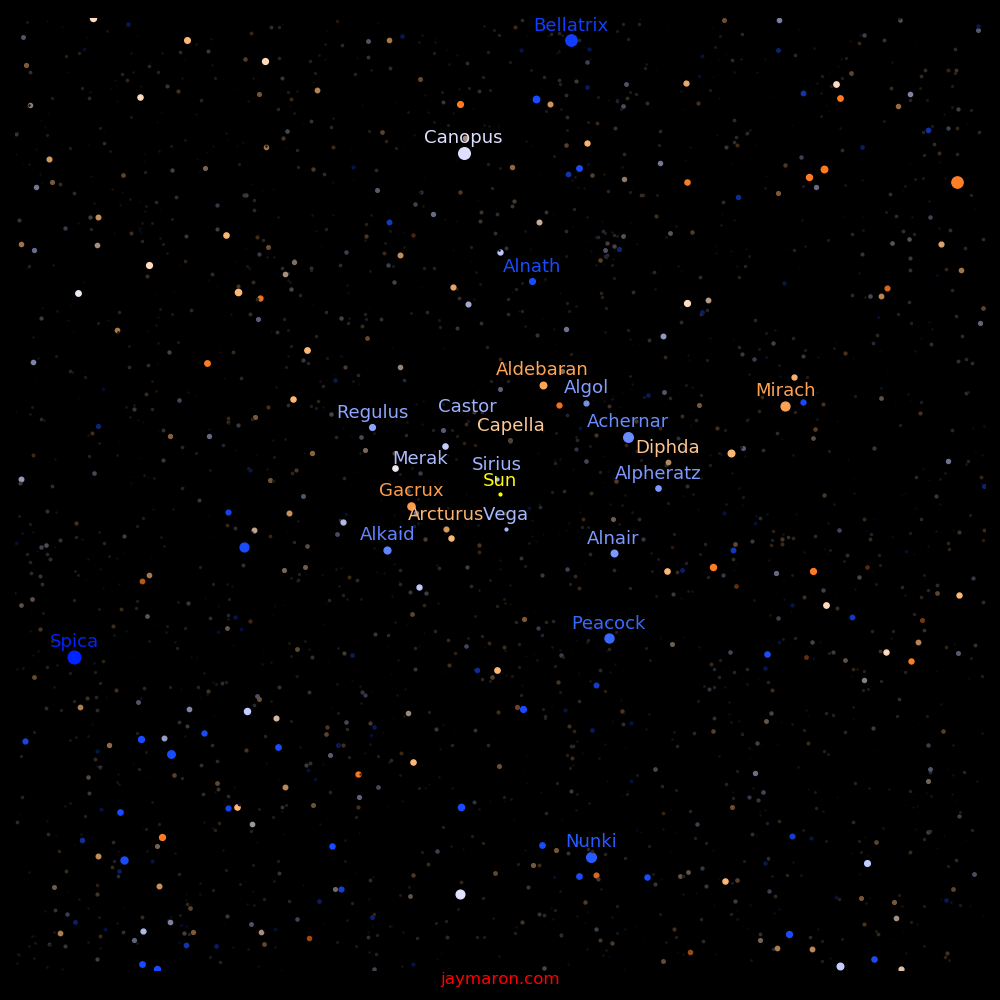
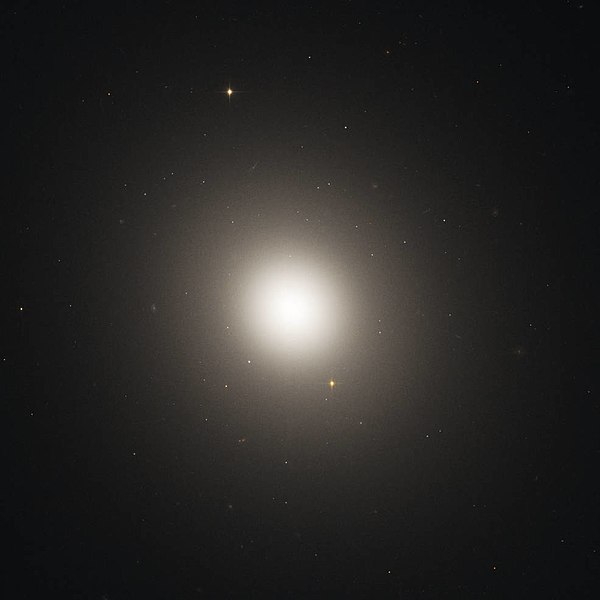
Sizes are to scale and colors are as your eye perceives. Brightness is scaled logarithmically. The image is 40 light years across.
 |
|---|
Proxima Centauri is the small red dot on top of Alpha Centauri. Beta Centauri is at the same place as Alpha Centauri, and is not shown.
Faint red dots are red dwarfs.
 |
 |
 |
 |
 |
 |
|||
|---|---|---|---|---|---|---|---|---|
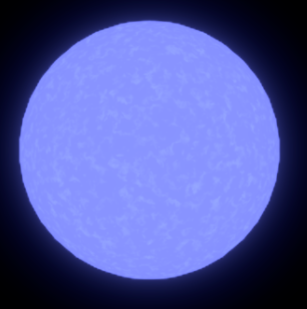
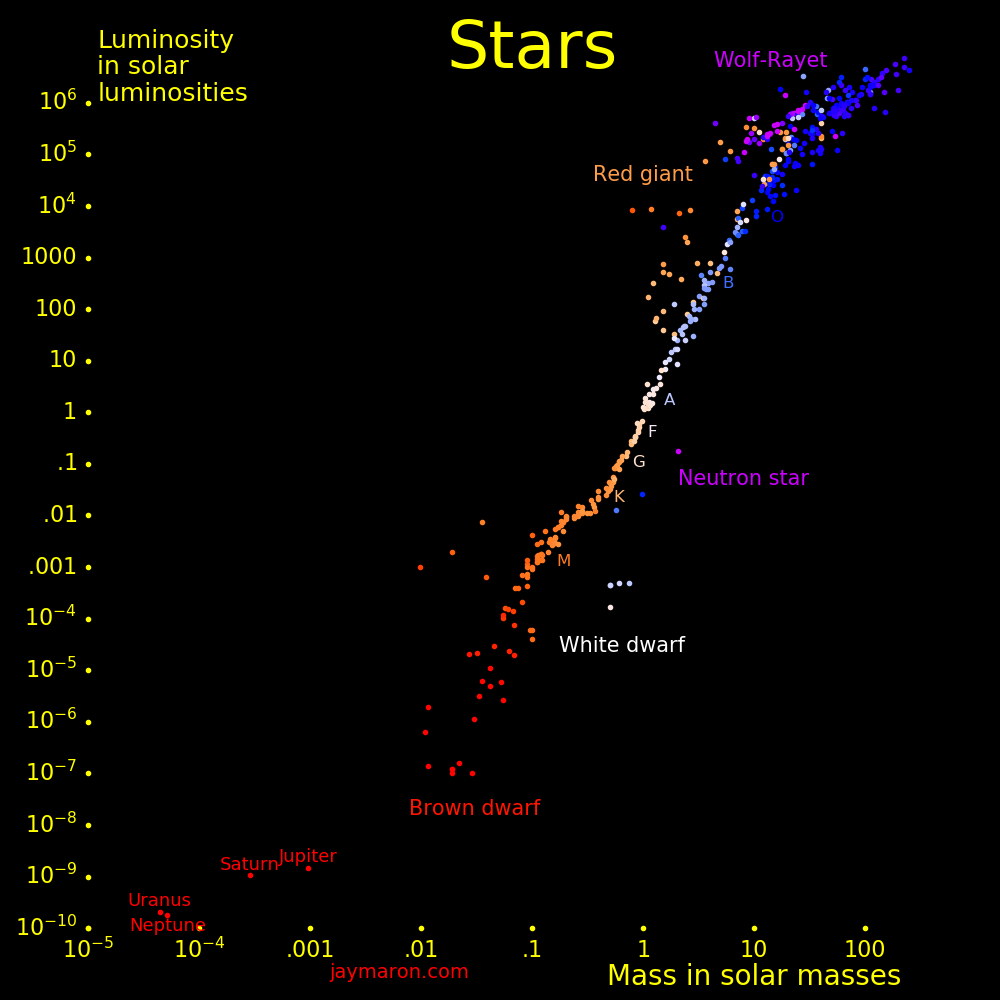
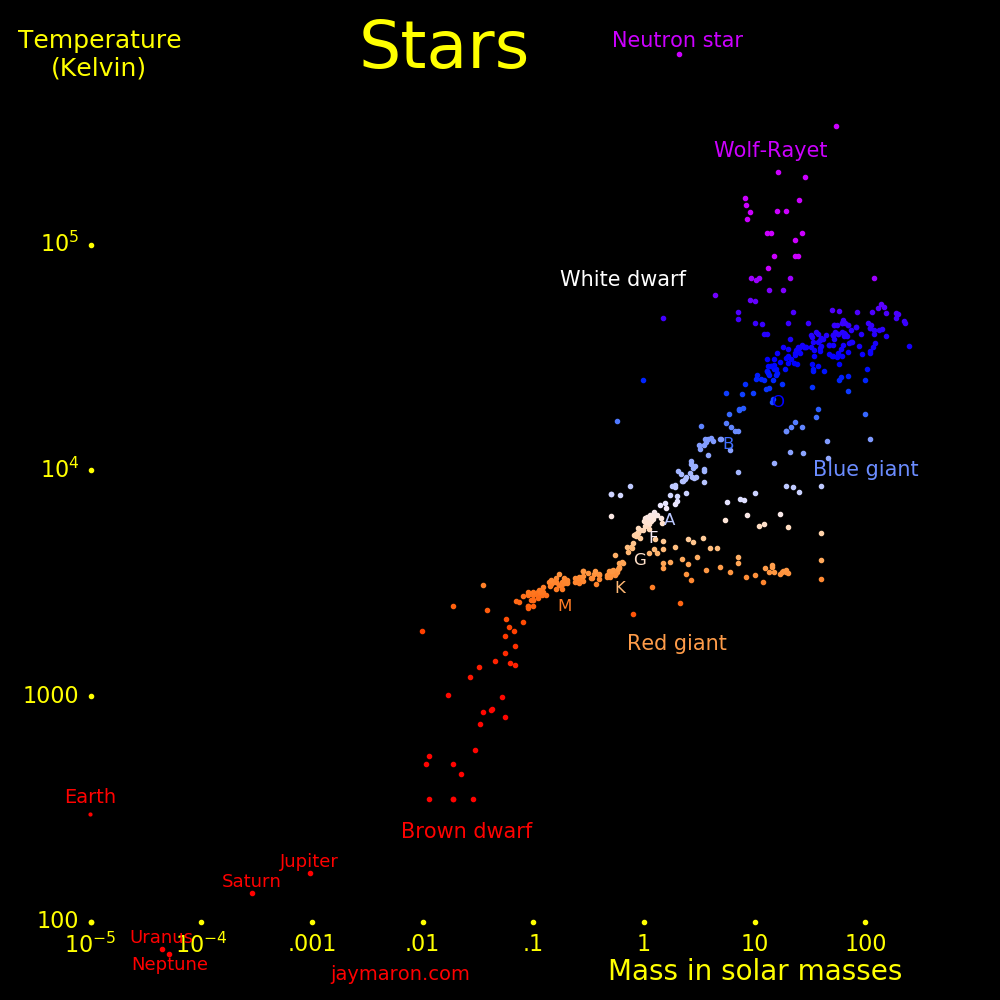
The sun is a G star.
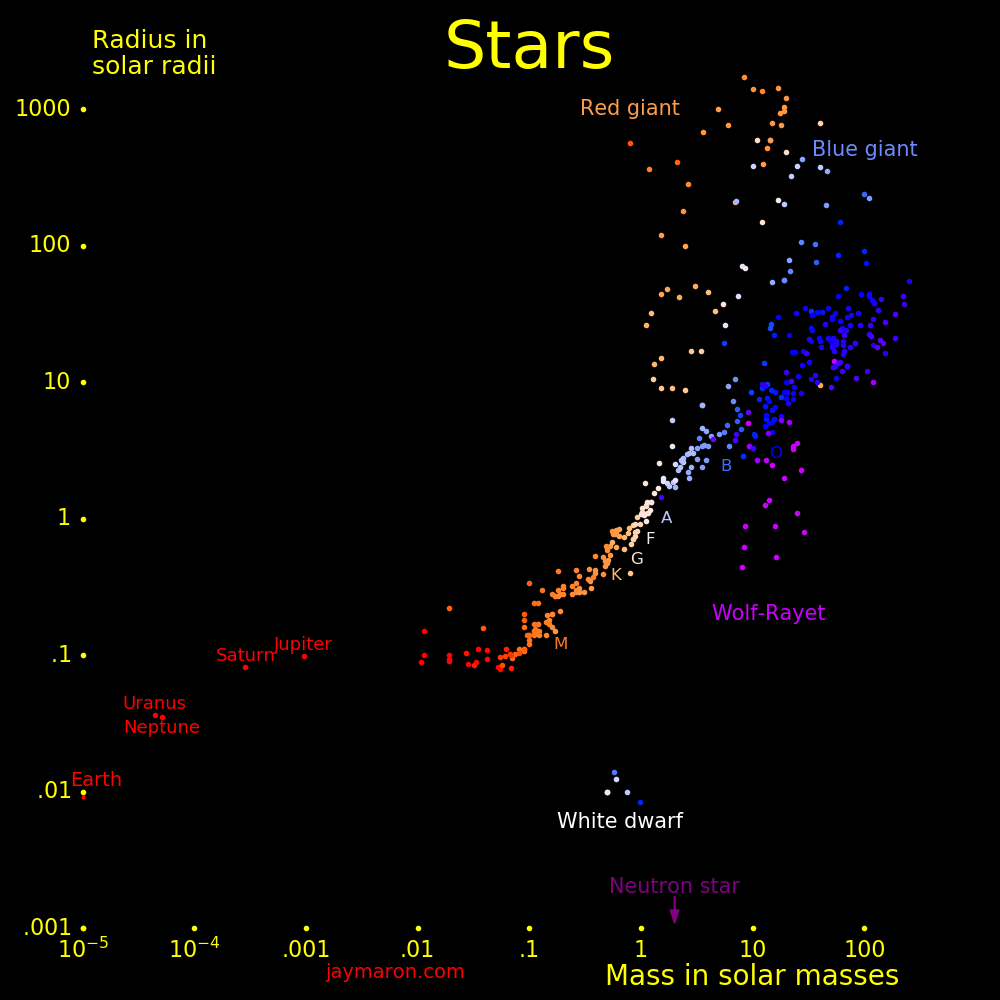
Sizes and colors are to scale. Brightness is not to scale. Blue giants are vastly brighter than red dwarfs.
Mass increases rightward.
 |
|---|
Color is as your eye perceives, and dot size scales with the logarithm of luminosity. The image is 500 light years across, and it's aligned with the galactic plane. If you are far away from the galaxy, such that all the stars are the same distance from you, then this is what you would see. The galaxy is a mix of red, orange, white, and blue stars, and they average to white.
 |
|---|
For stars, color is as your eye perceives, and dot size scales with the logrithm of luminosity. The image is 5000 light years across, and it's aligned with the galactic plane.
 |
|---|
 |
|---|
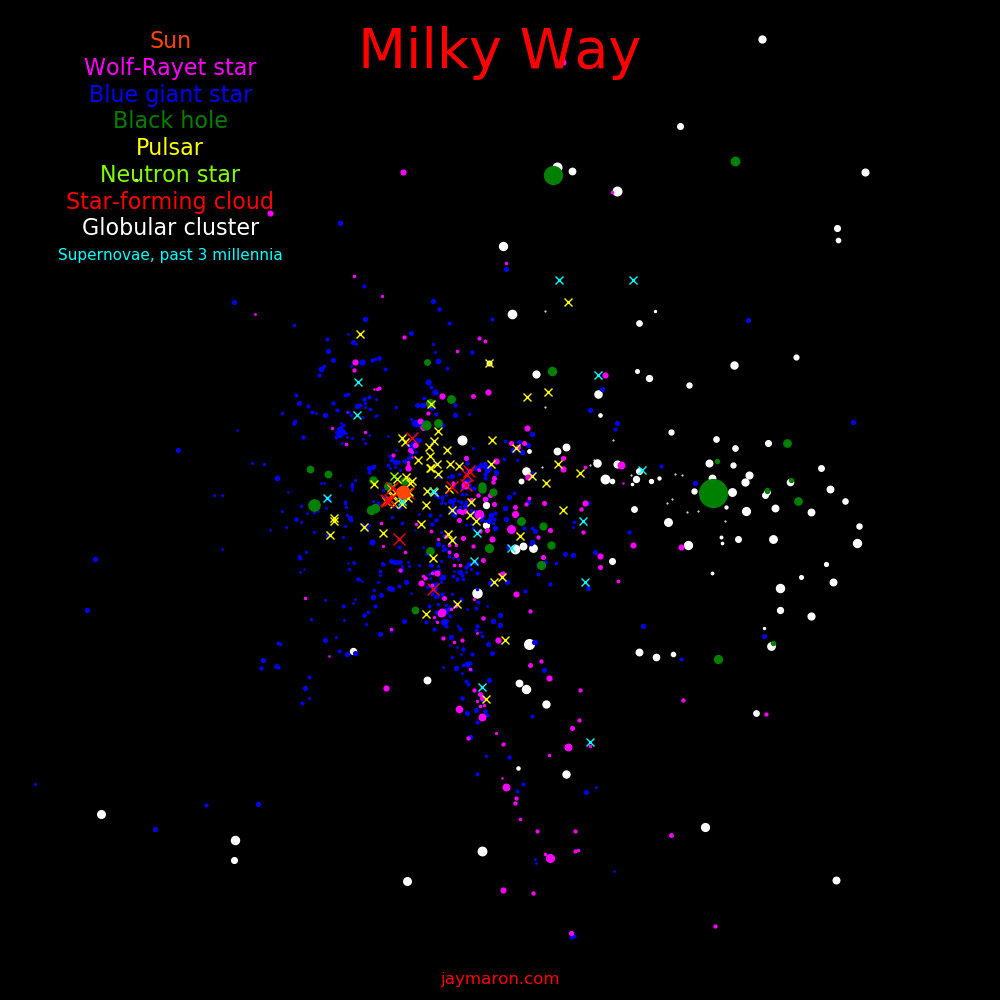
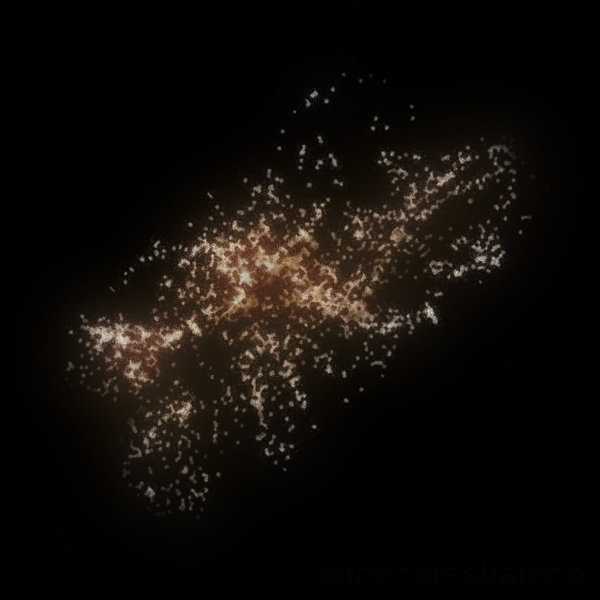
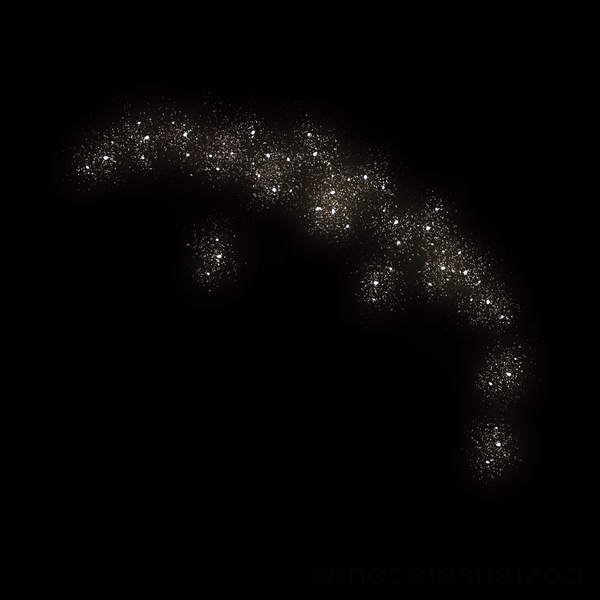
The big green dot is the supermassive black hole at the center of the galaxy, and the sun is to the left. The image is 80000 light years across.
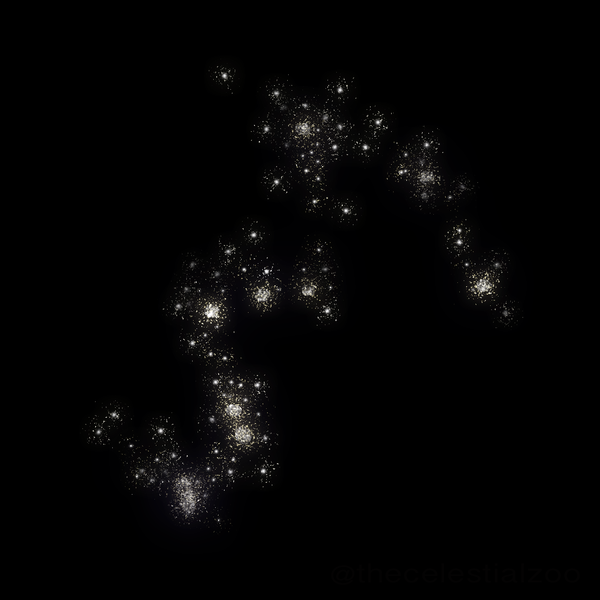
Globular clusters are centered around the galaxy center.
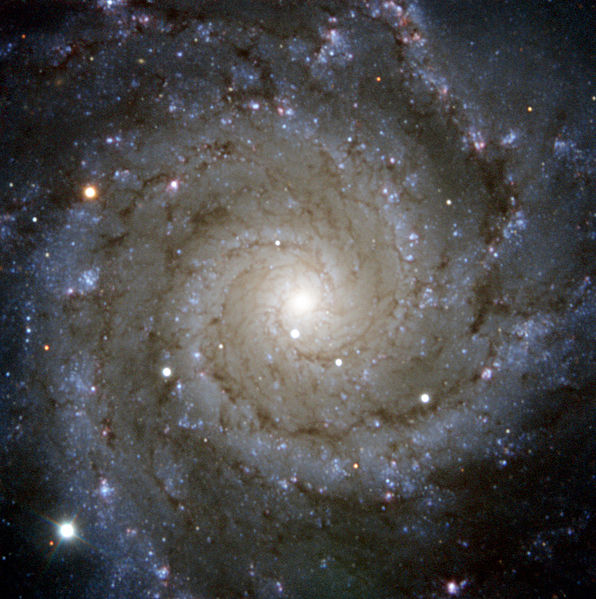
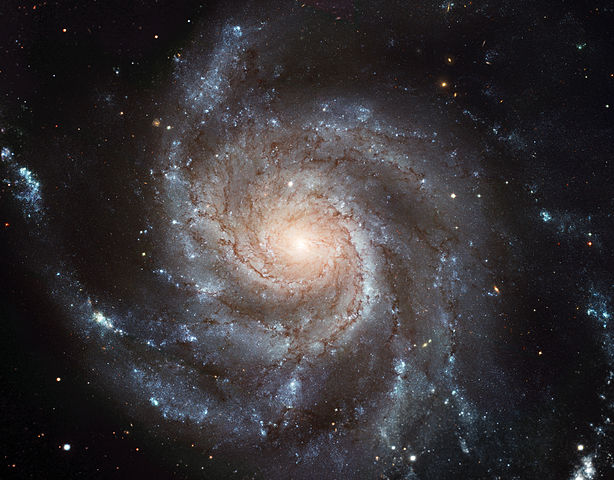
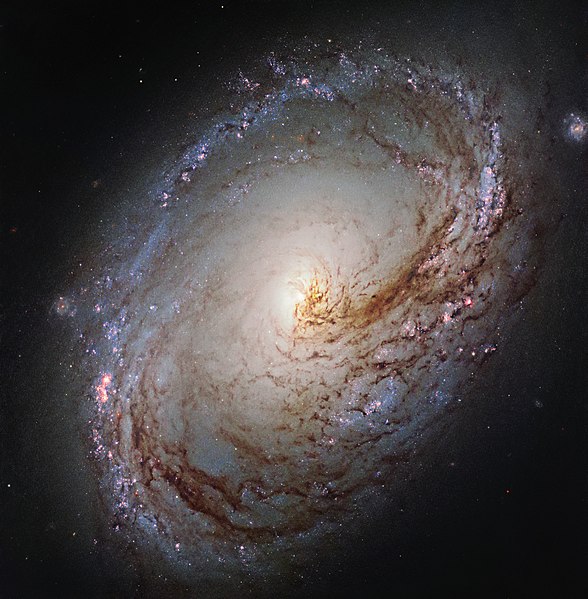
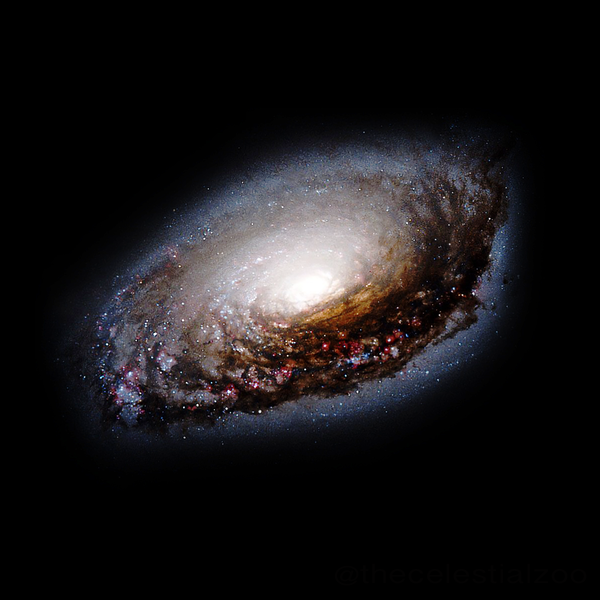
The sun is in a spiral arm, which is mapped out by stars and star-forming clouds.
Most of the far side of the galaxy is obscured by dust, which is why most of the objects are on the near side of the galaxy. Globular clusters and blue giant stars are bright enough to be seen on the far side of the galaxy.
 |
|---|
 |
|---|
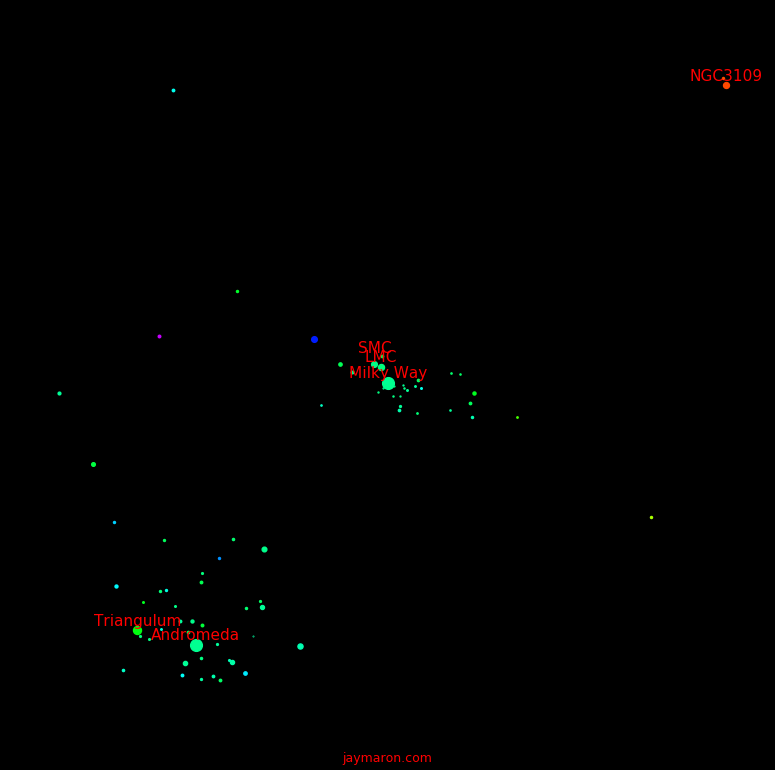
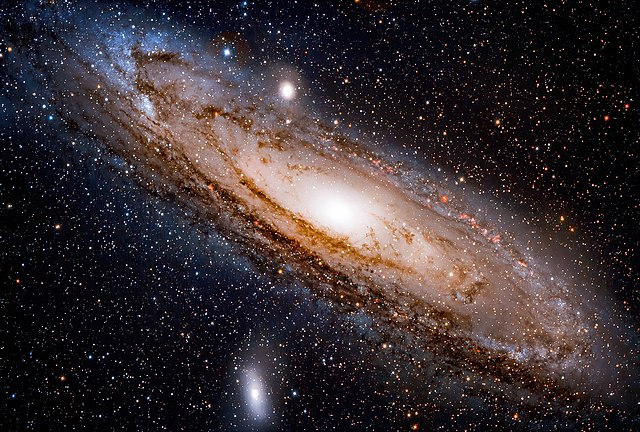
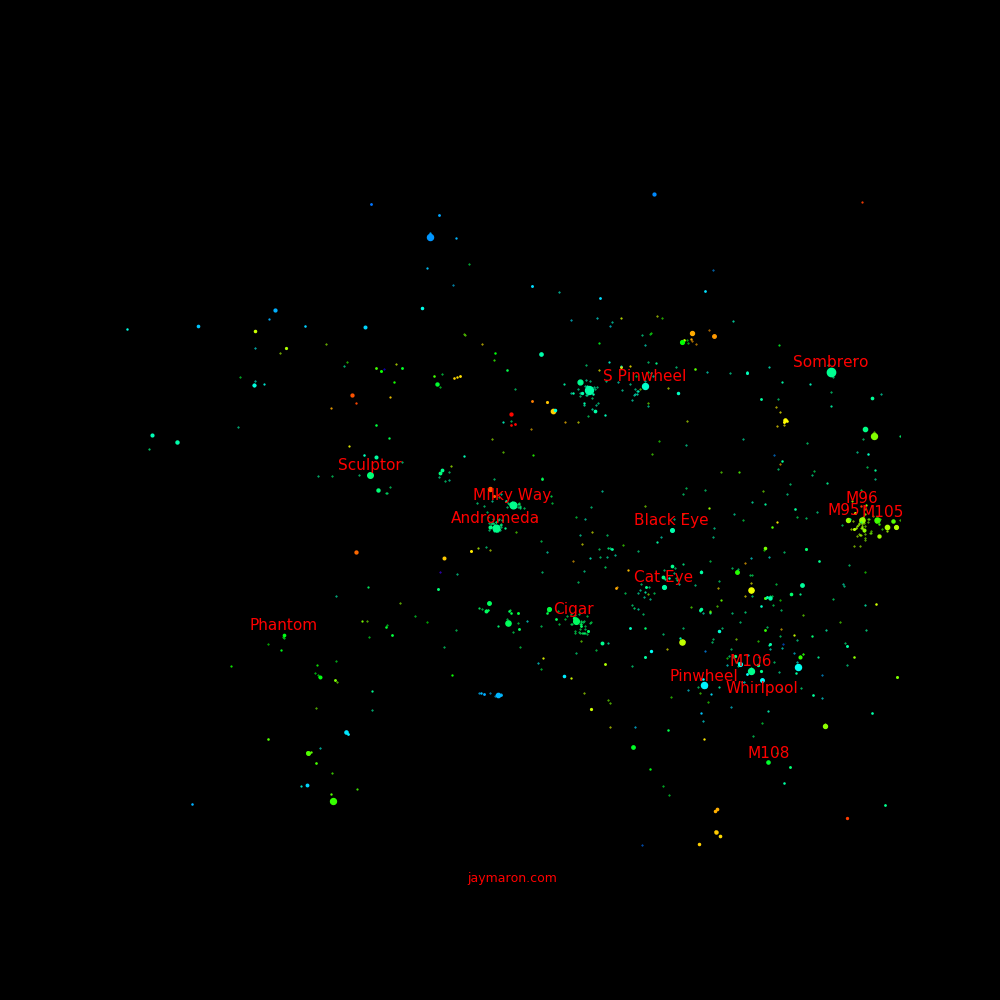
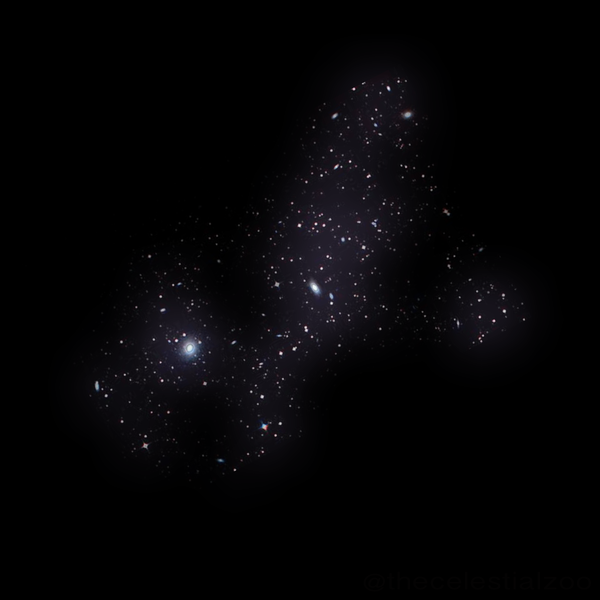
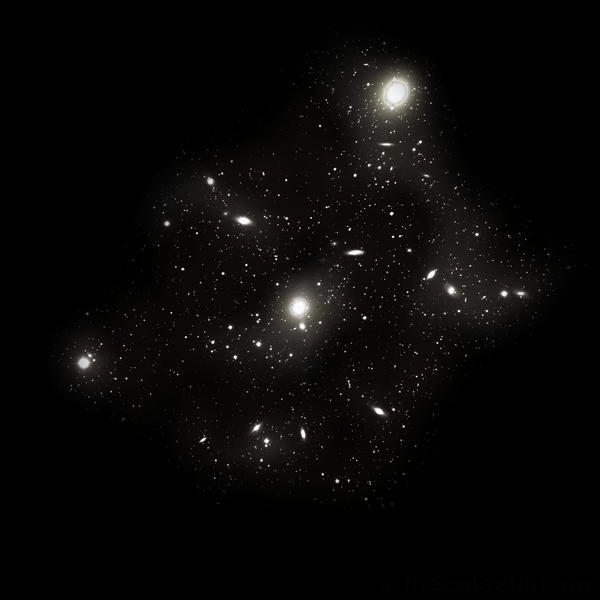
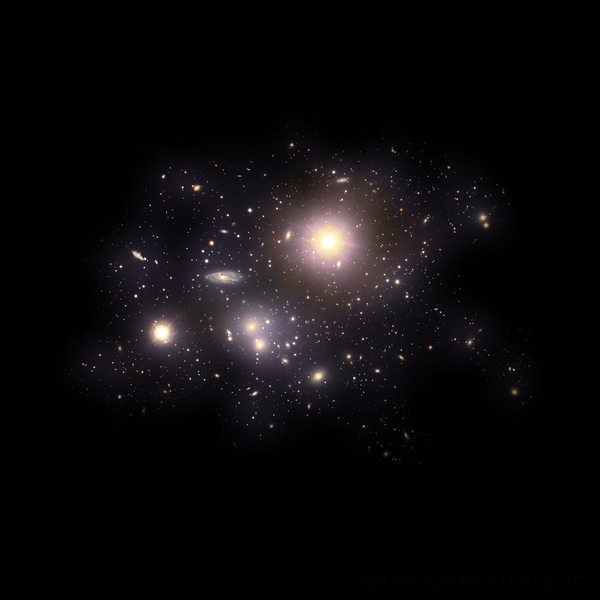
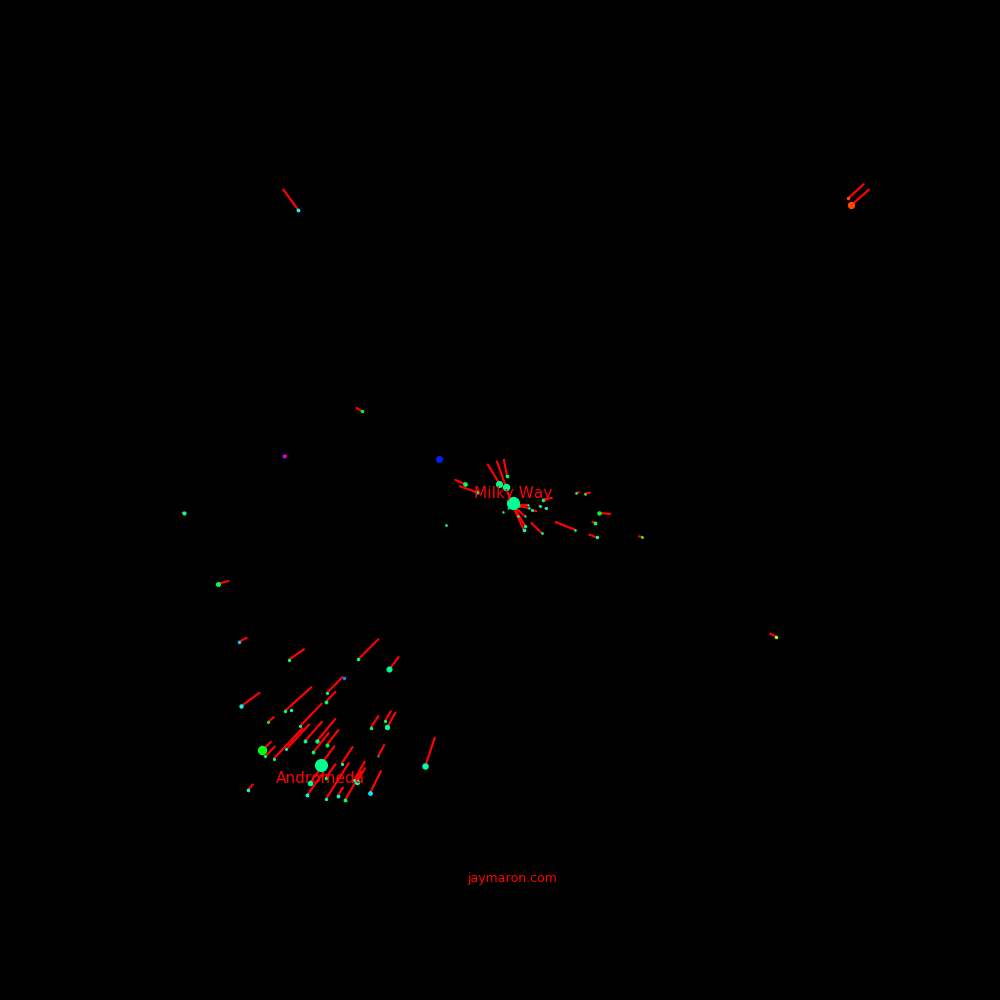
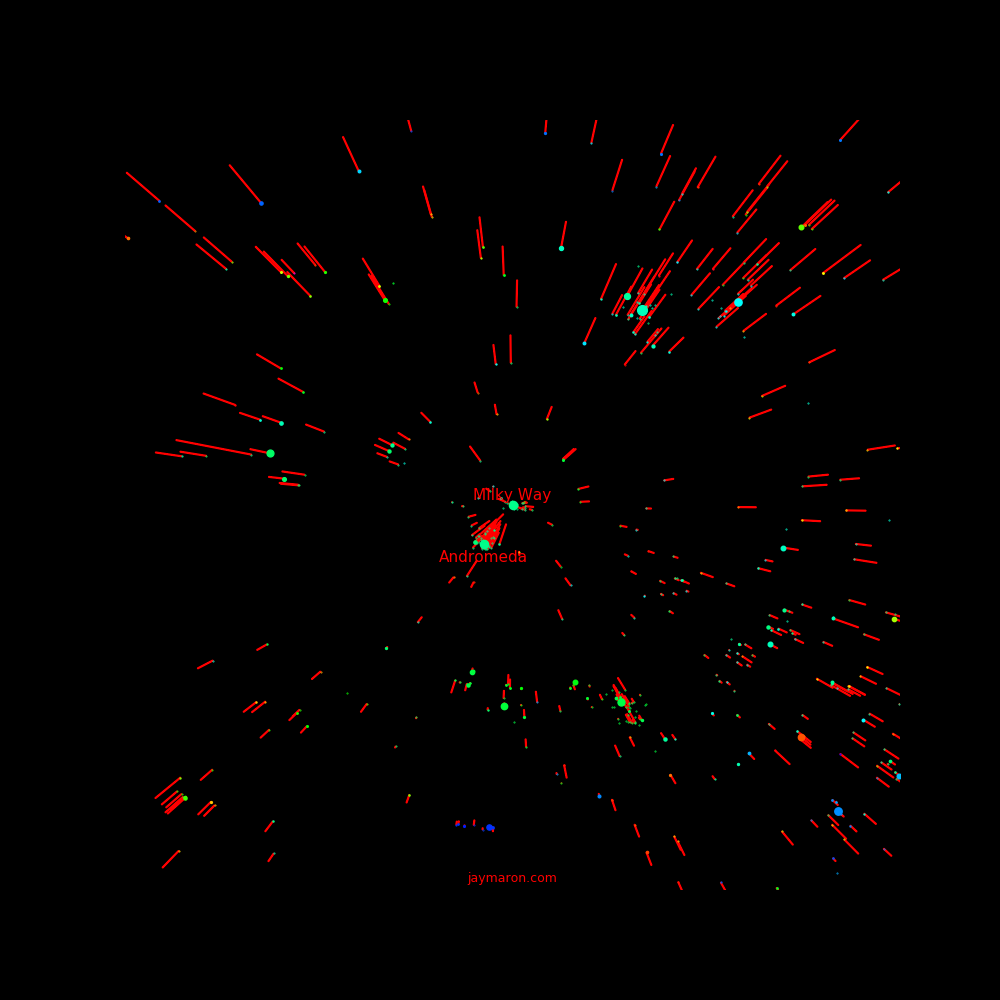
The largest galaxies in the local group are the Milky Way and Andromeda. Sizes and distances are to scale. The image is 6 million light years across. Color indicates the Z coordinate. Blue points have positive Z, red points have negative Z, and green points have Z=0.
 |
 |
 |
 |
|---|---|---|---|
 |
|---|
Most galaxies lie in a plane, the "supergalactic plane". This is why most of them are green. The plane Z=0 is aligned with the supergalactic plane.
 |
 |
 |
 |
 |
 |
 |
 |
 |
 |
 |
 |
 |
 |
|---|---|---|---|---|---|---|---|---|---|---|---|---|---|
 |
|---|
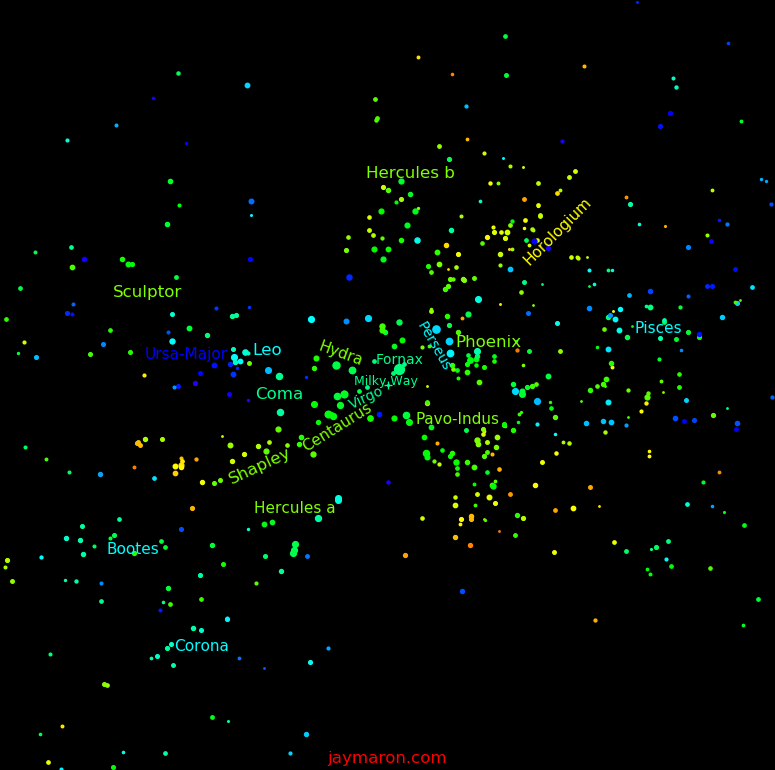
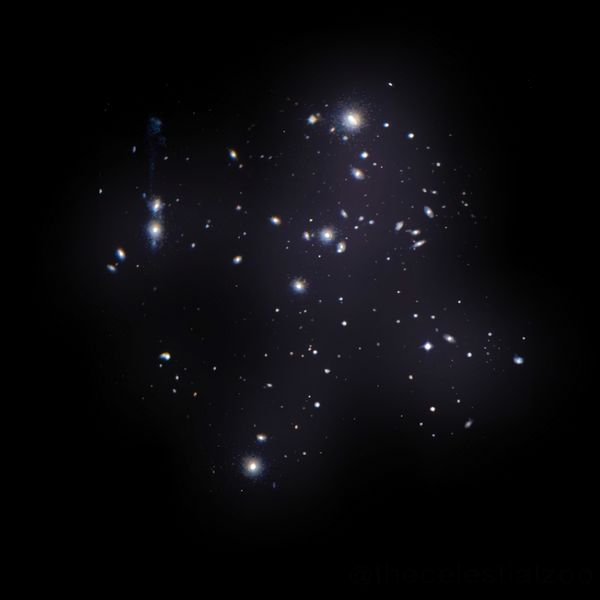
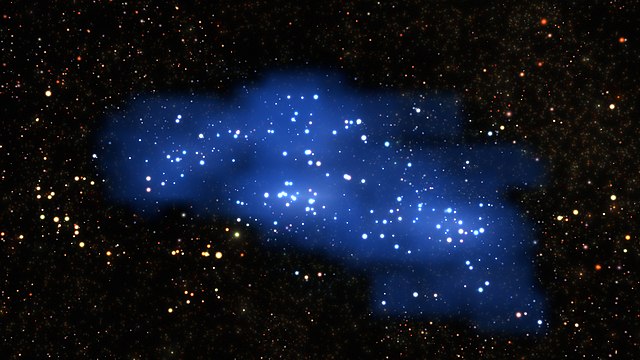
Dots are "Abell clusters", which are clusters of galaxies. Abell clusters are often grouped into superclusters.
The image is 2000 million light years across. Blue points have positive Z, red points have negative Z, and green points have Z=0.
Most superclusters lie in a plane, the "supergalactic plane". This is why most of them are green. The plane Z=0 is aligned with the supergalactic plane.
 |
 |
 |
 |
 |
 |
 |
|---|---|---|---|---|---|---|
 |
 |
 |
 |
 |
 |
 |
|---|---|---|---|---|---|---|
This shows the galaxies of the local group and their radial velocities. Most galaxies are heading in the direction of the Milky Way. Andromeda is headed for a collision with the Milky Way. The LMC and SMC are headed away from us but they will turn around and crash into the Milky Way.
 |
|---|
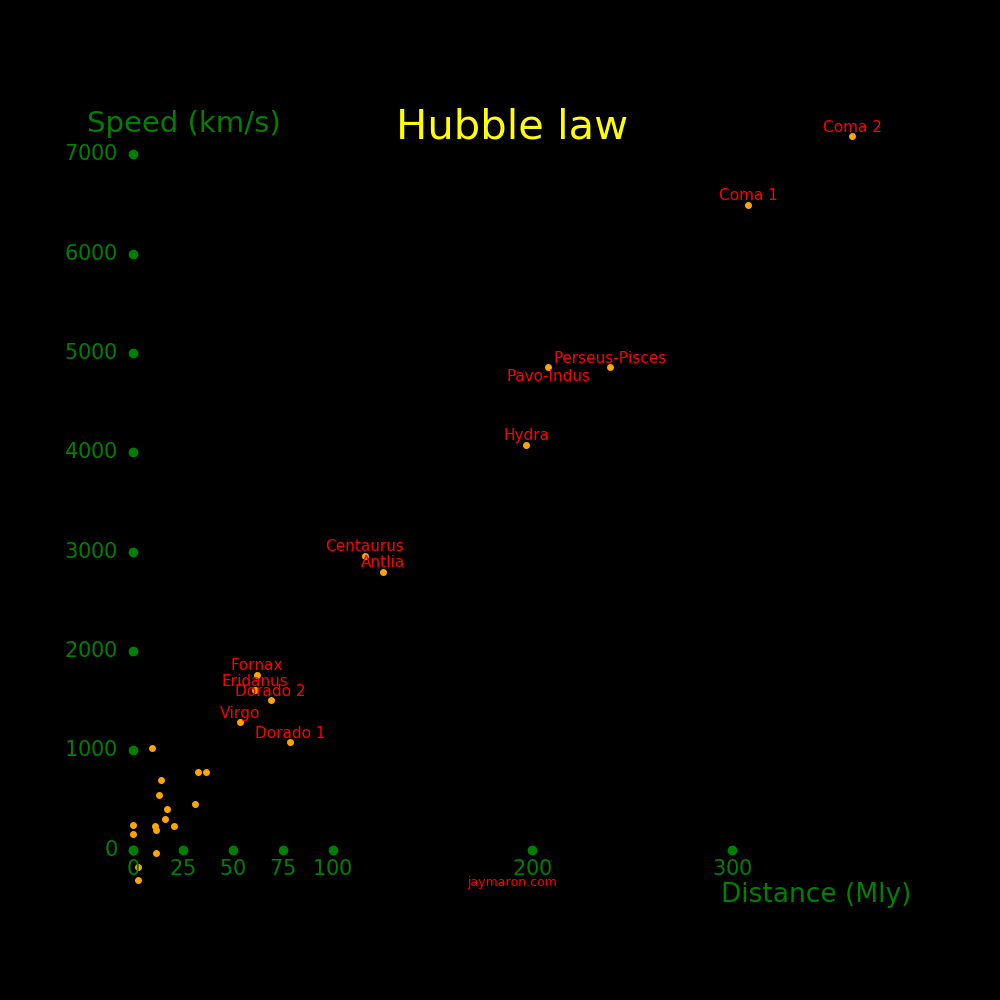
This shows the Hubble law. Nearby galaxies tend to be moving toward us and distant galaxes are always moving away from us. The farther the galaxy, the faster it tends to move away from us.
 |
|---|
The universe expands according to the Hubble law. If there were no gravity, all galaxies would fall on the Hubble line. Departures rom the Hubble law are due to gravity between galaxies.
For each cluster, we identified the largest galaxies and used these for the plot. Each point represents a galaxy, and the label denotes what cluster the galaxy belongs go.
 |
|---|
 |
|---|
 |
|---|
 |
|---|
 |
|---|
 |
|---|
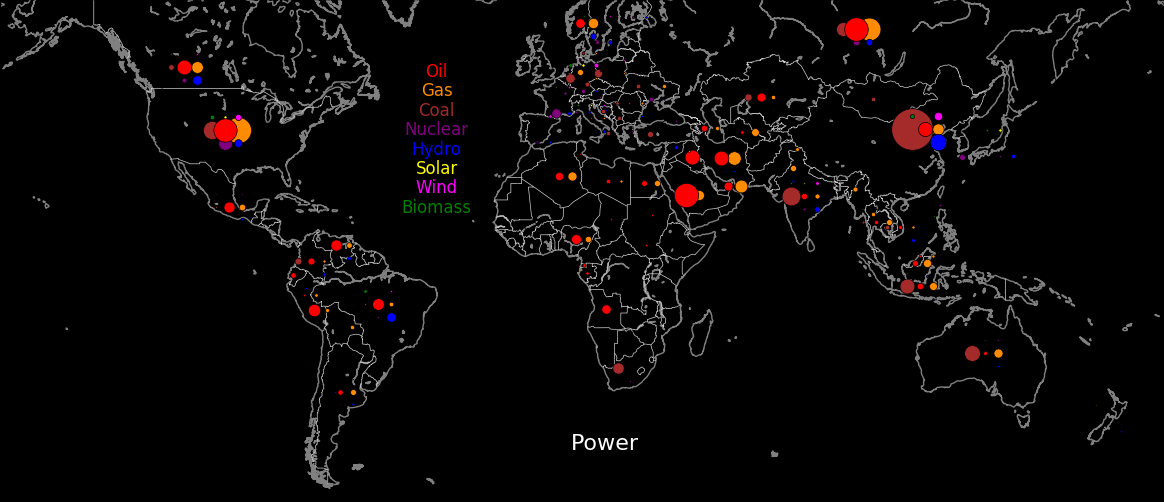
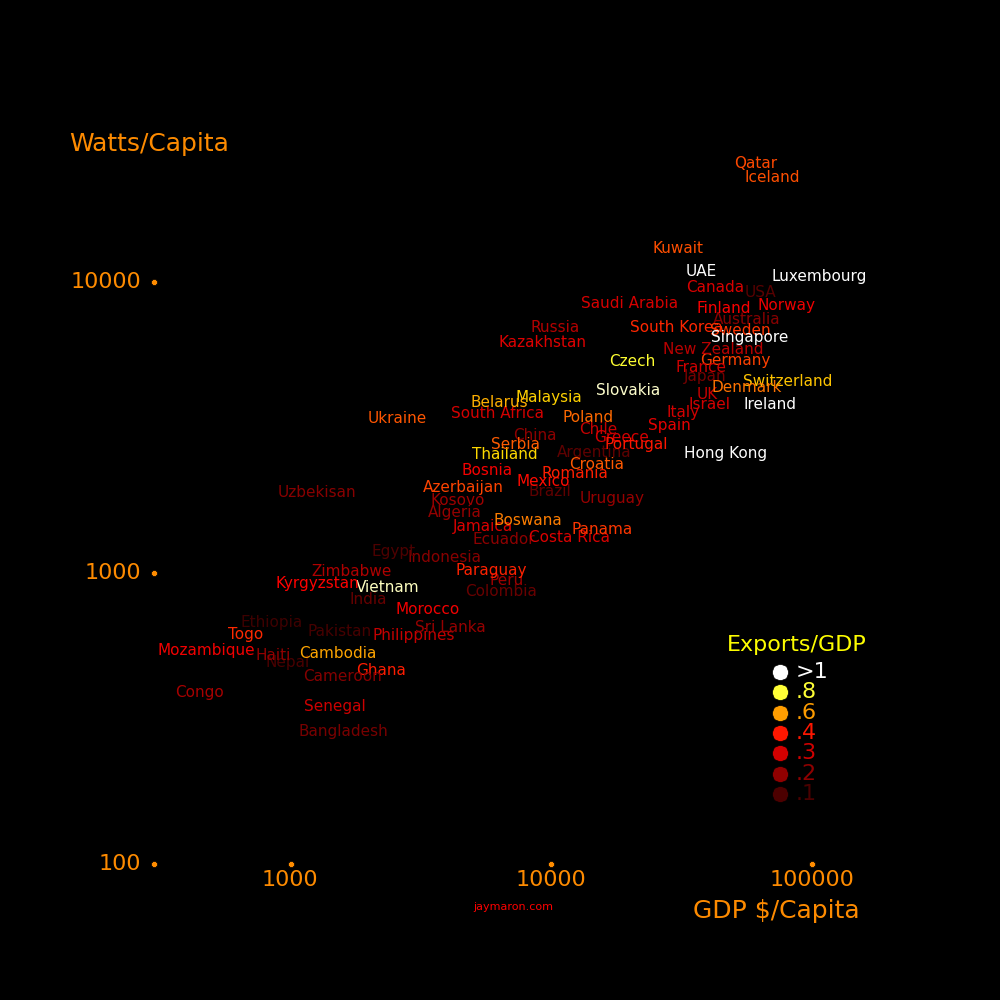
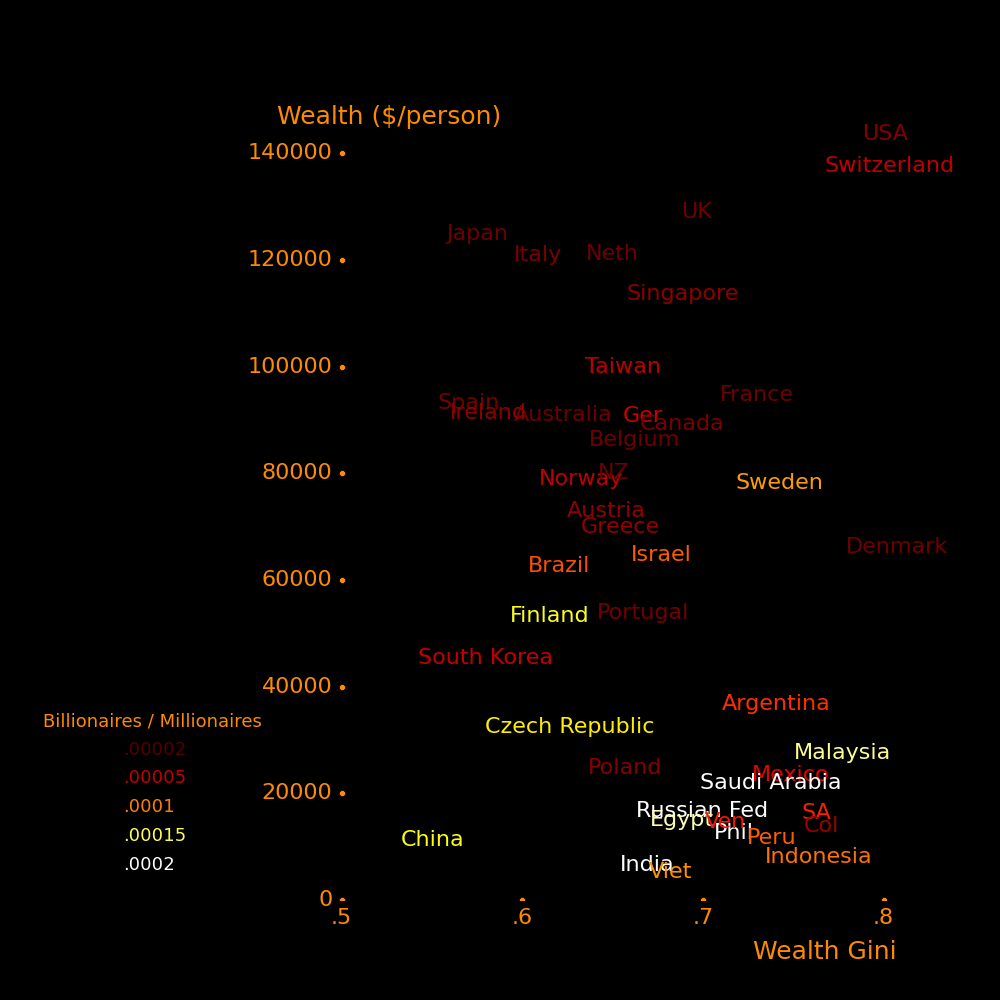
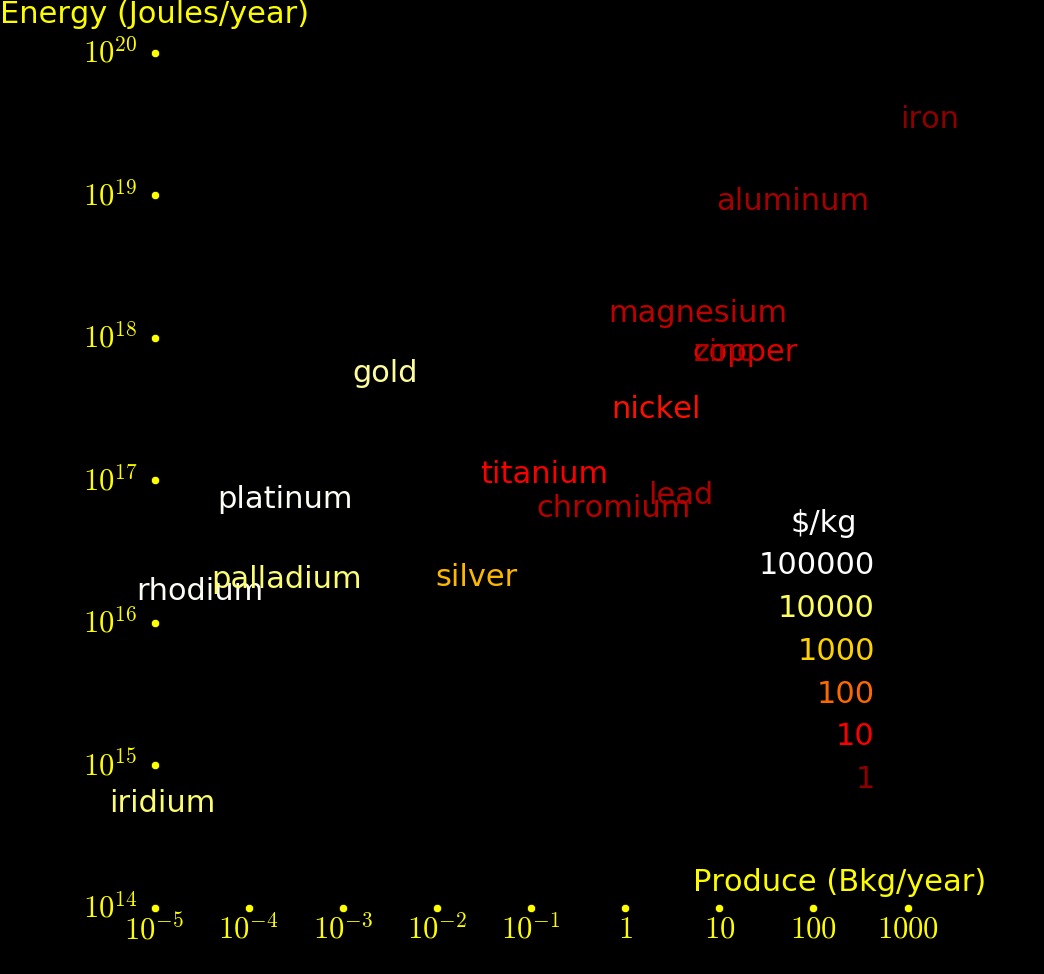
A nation's GDP and power consumption correlated.
 |
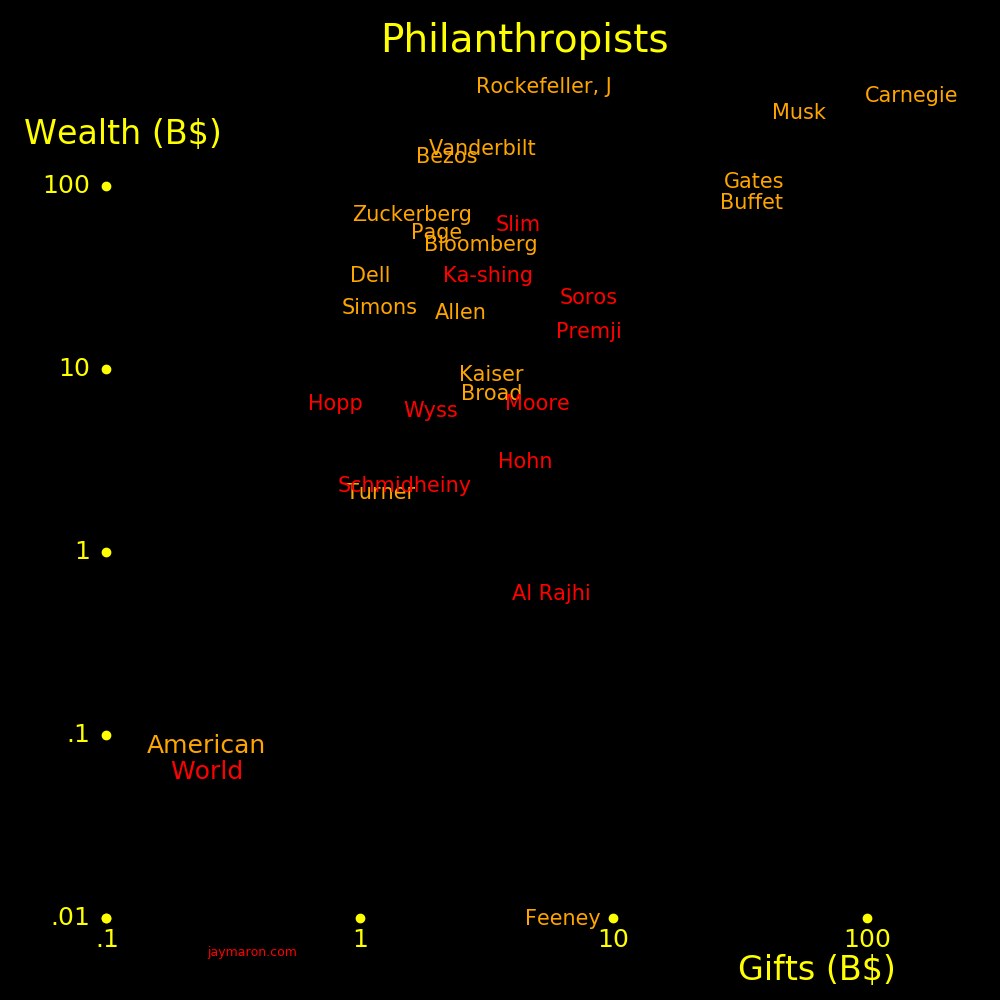 |
The Gini coefficient characterizes a nation's wealth distribution. The larger the Gini coefficient, the more concentrated the wealth.
 |
 |
|---|
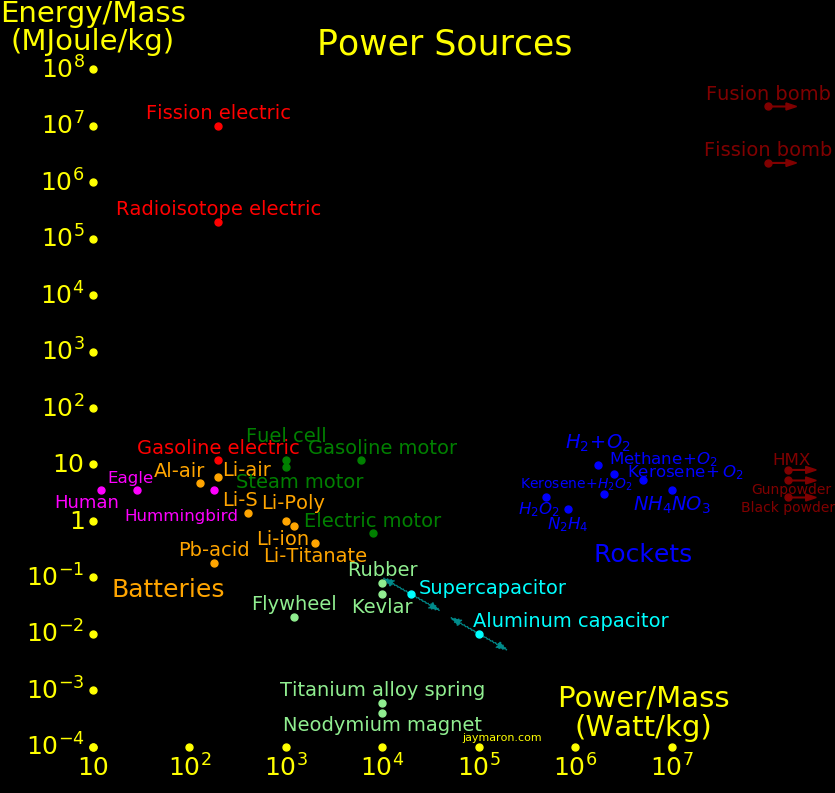
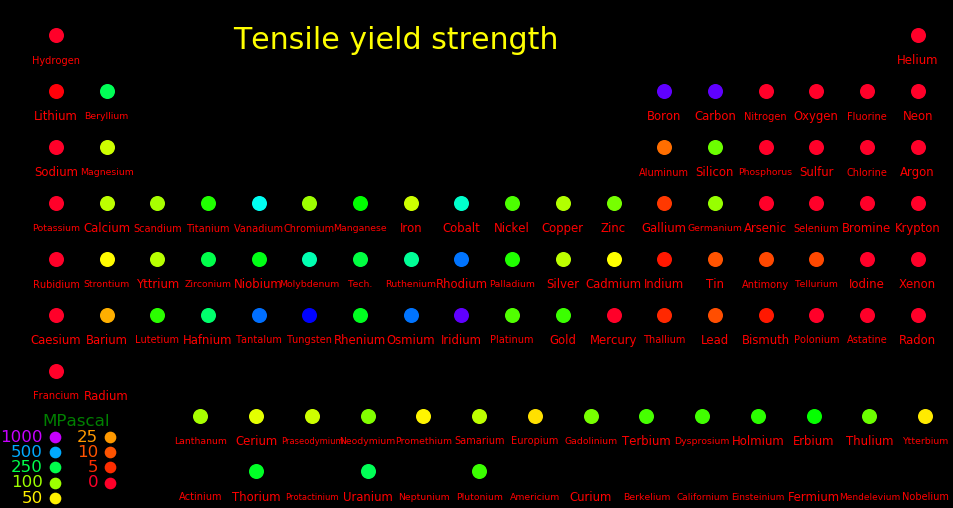
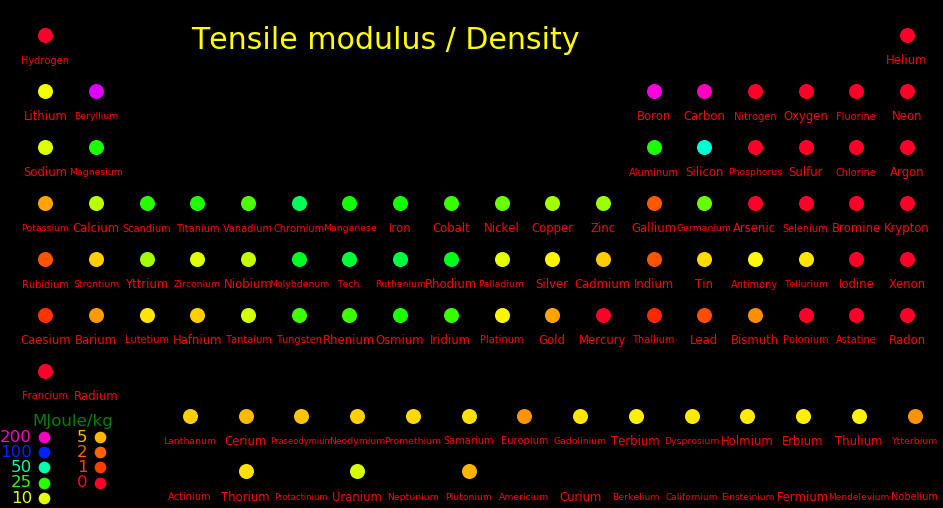
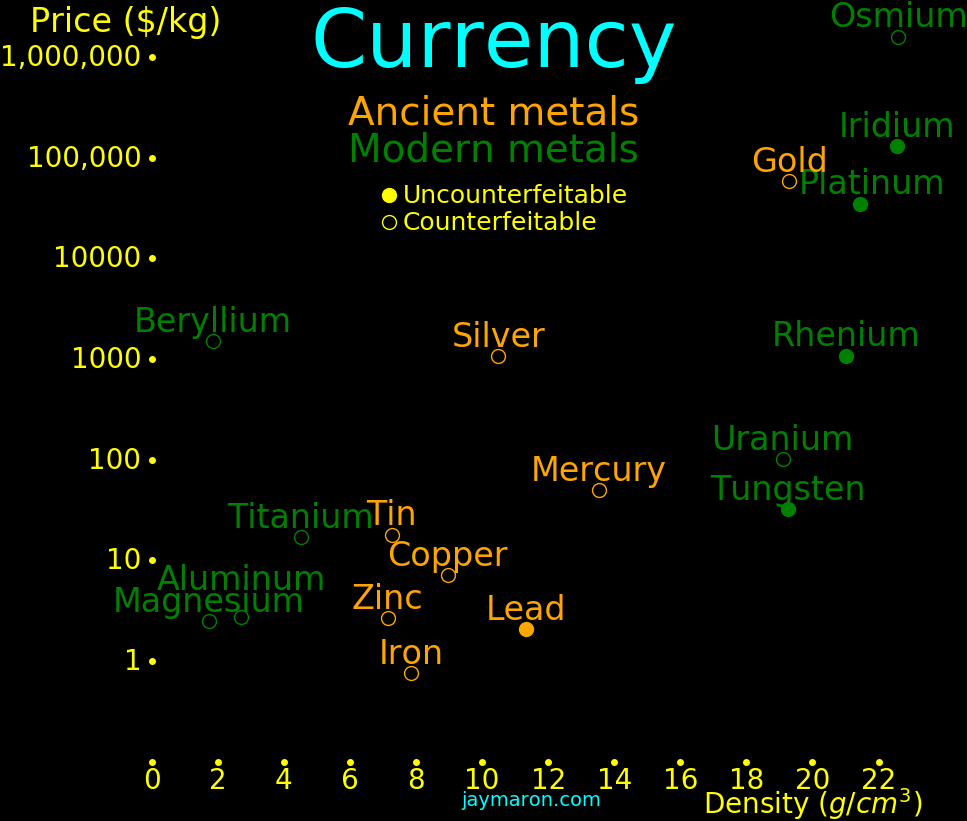
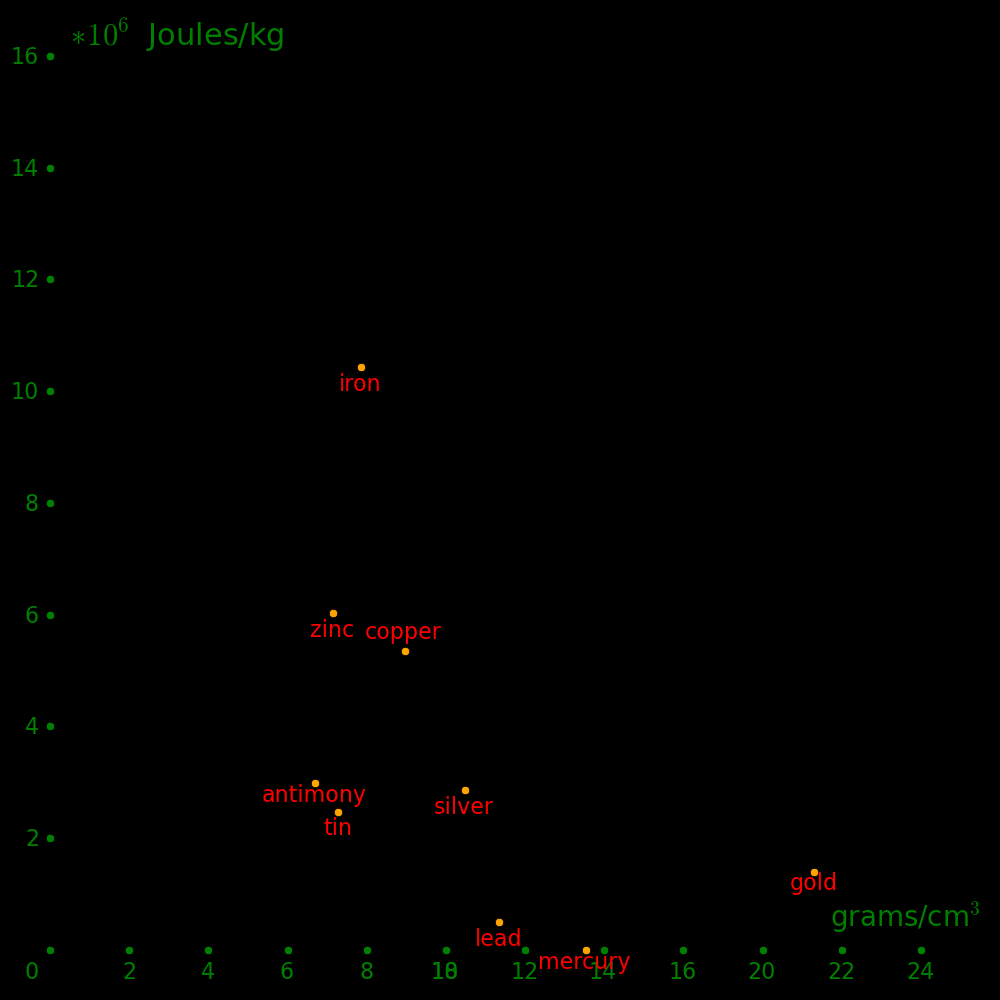
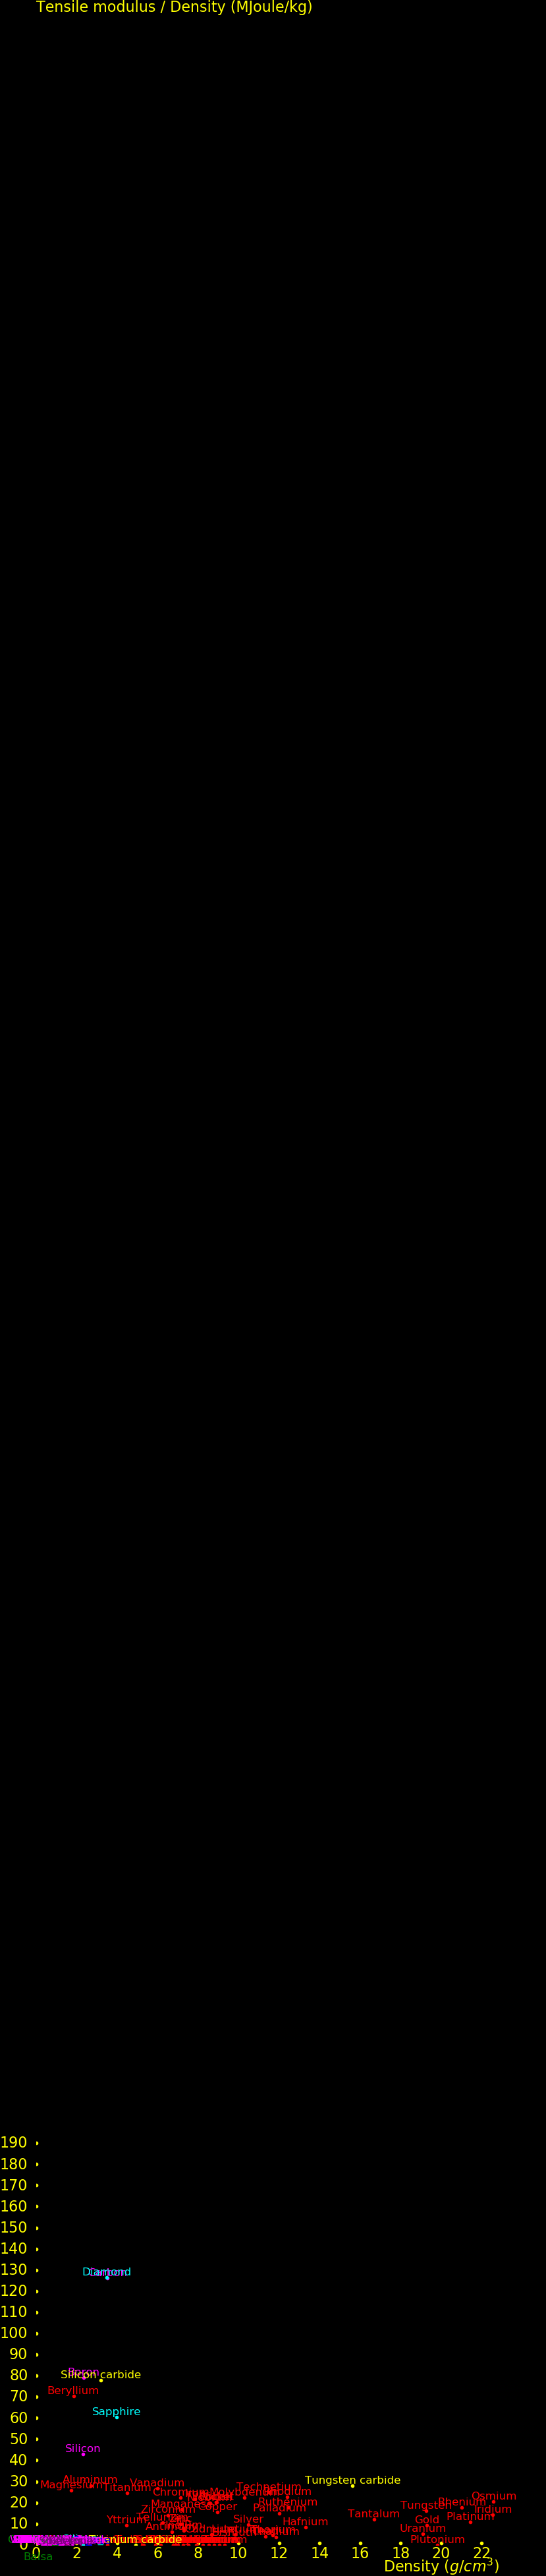
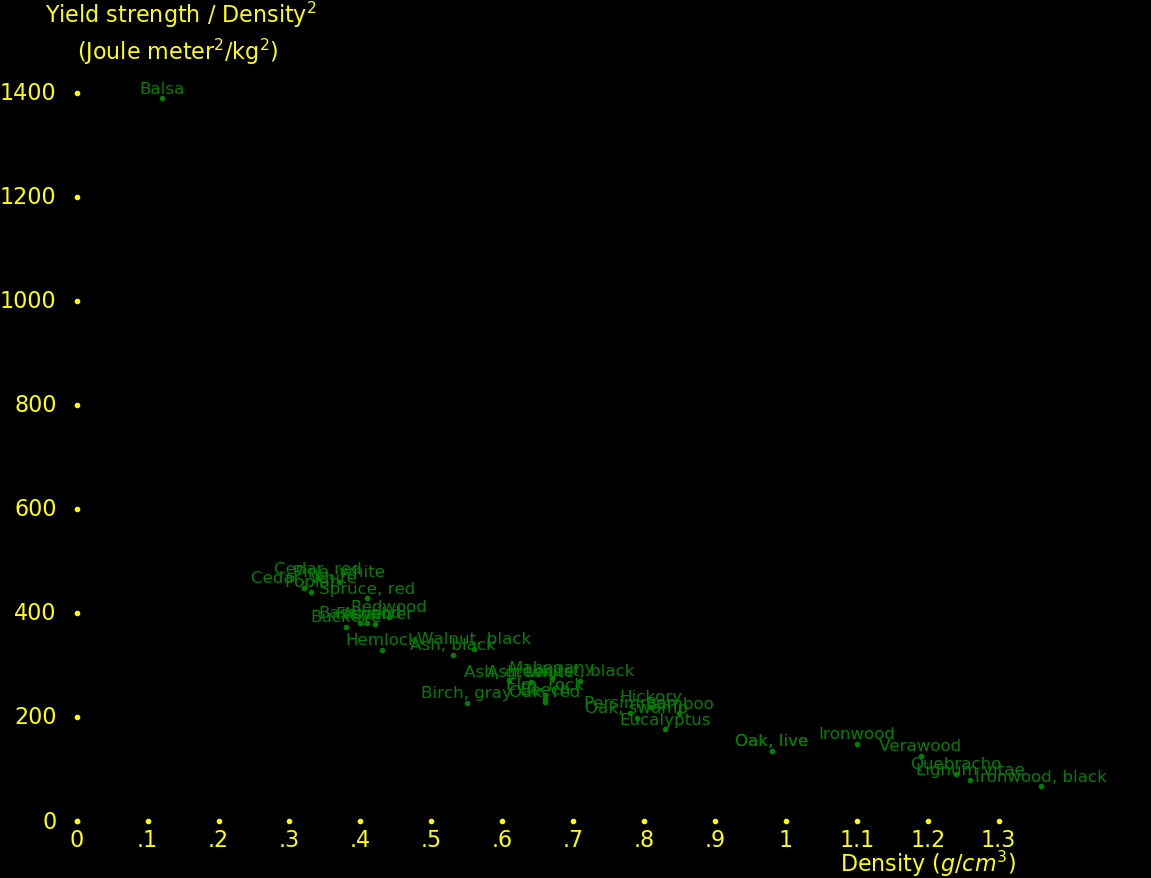
The plot shows the elastic strength of materials Alloys are much stronger than pure metals. Kevlar is substantially stronger than metals.
 |
|---|
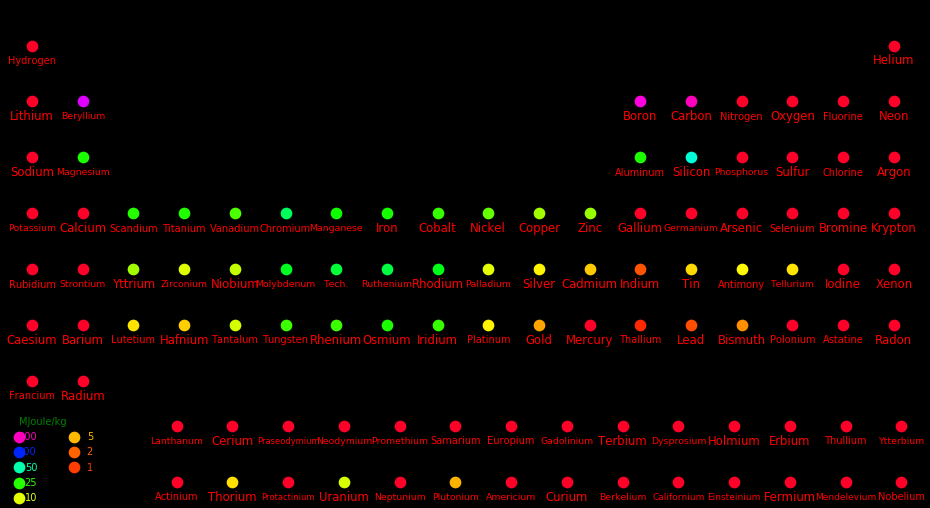
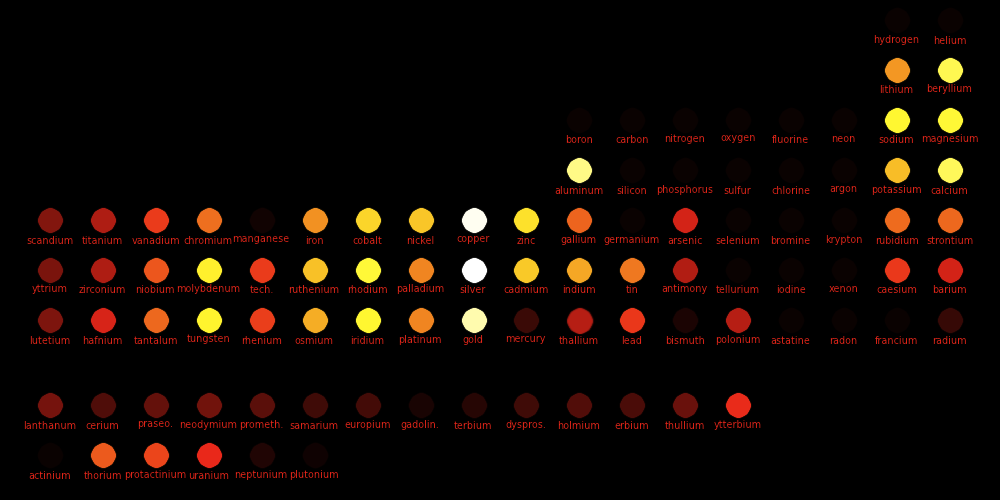
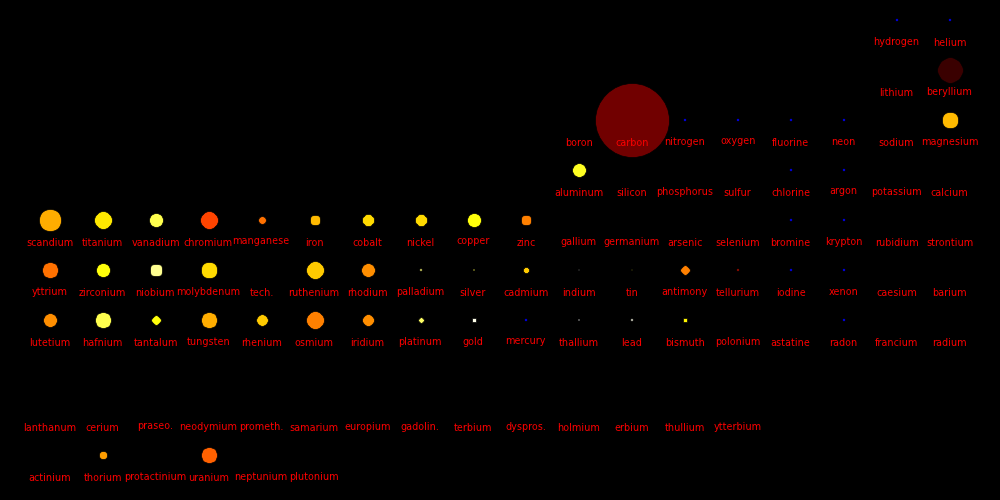
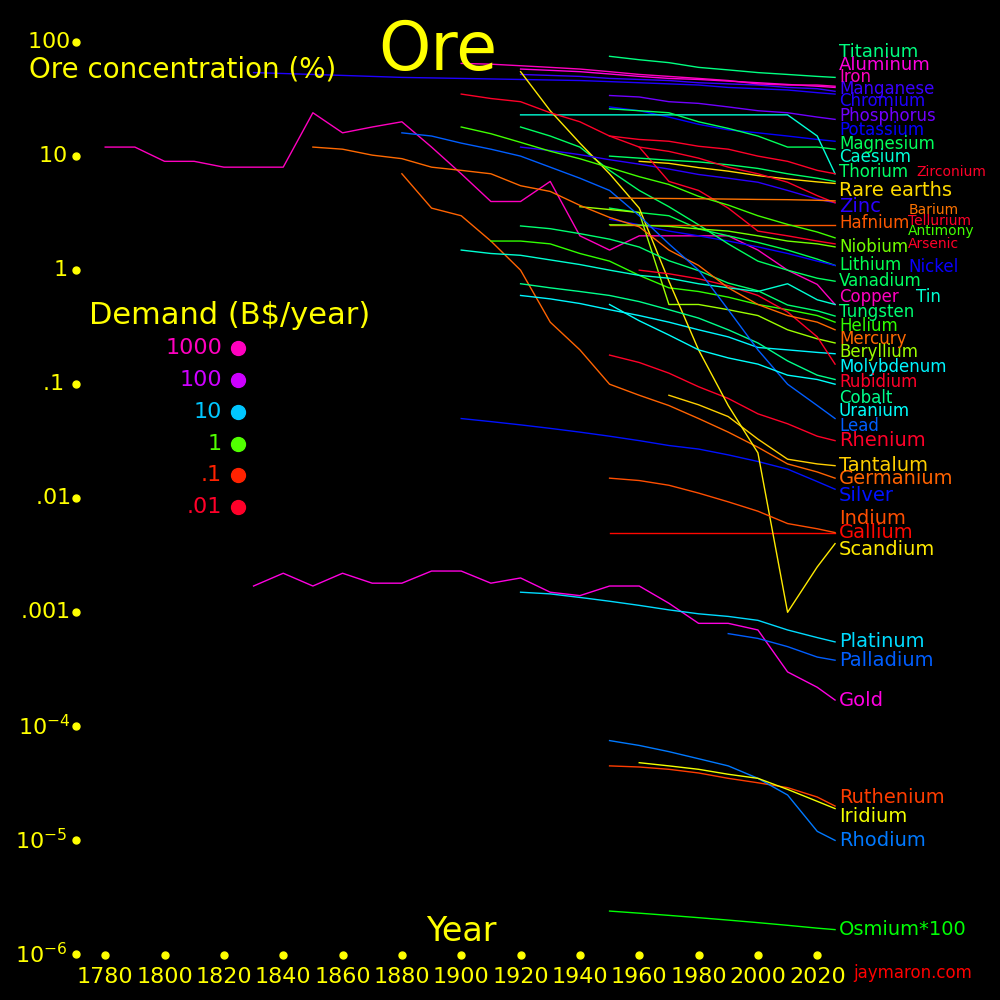
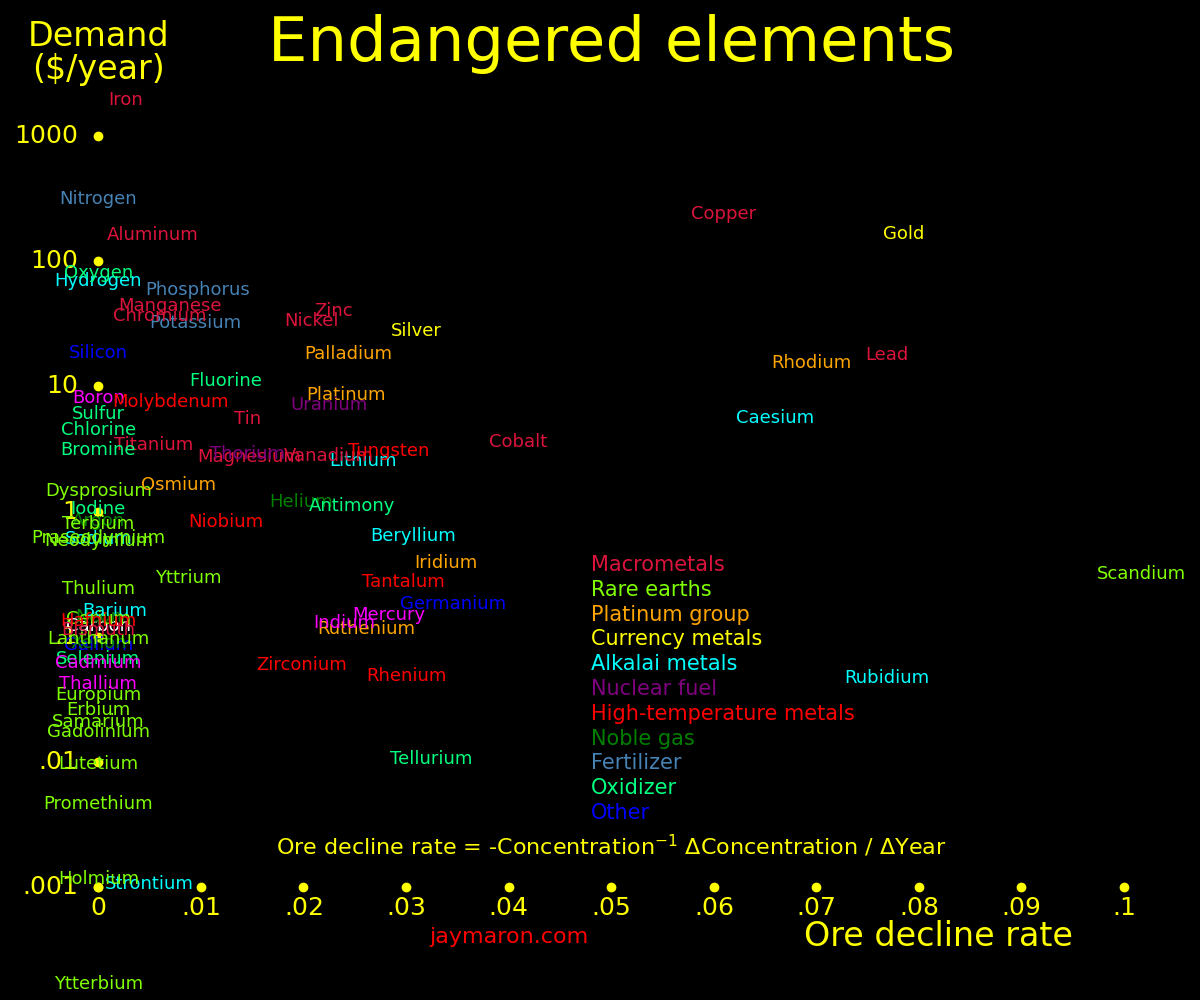
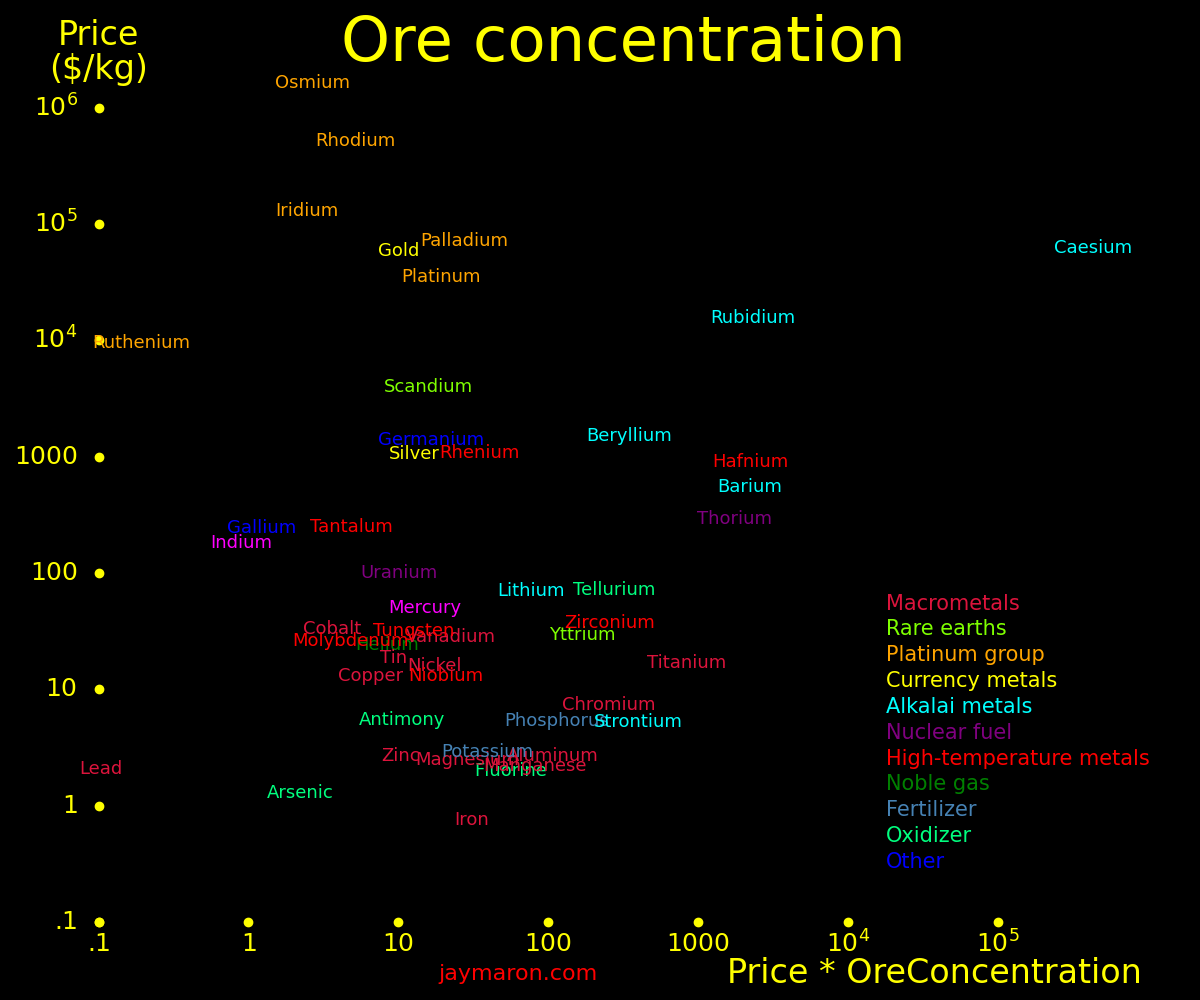
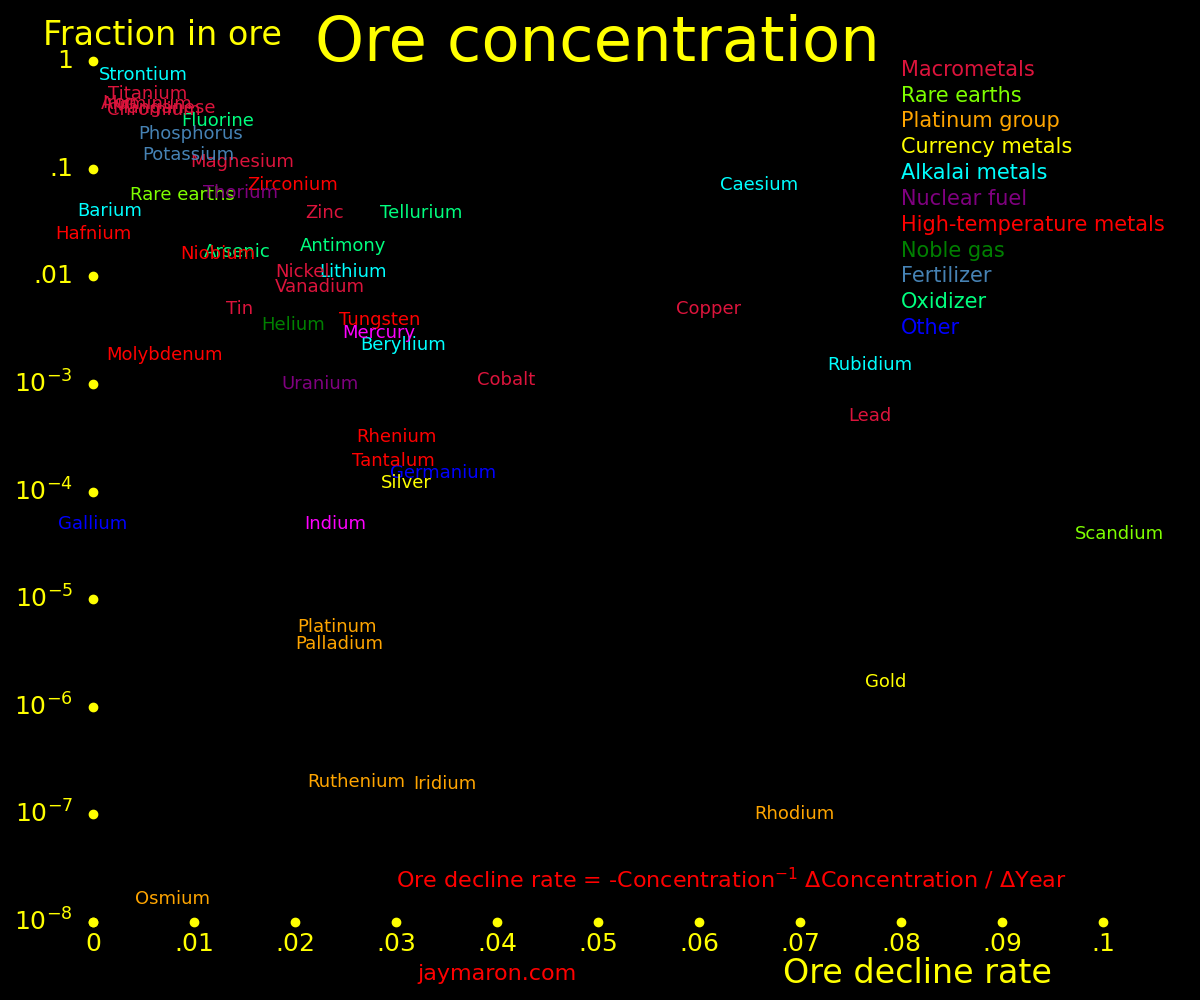
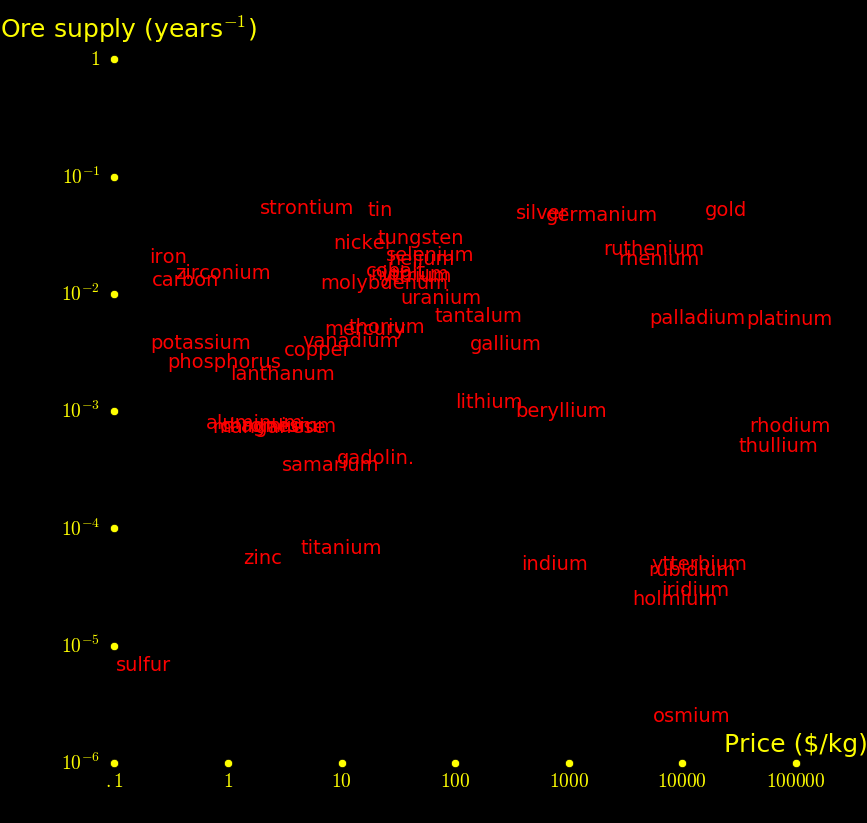
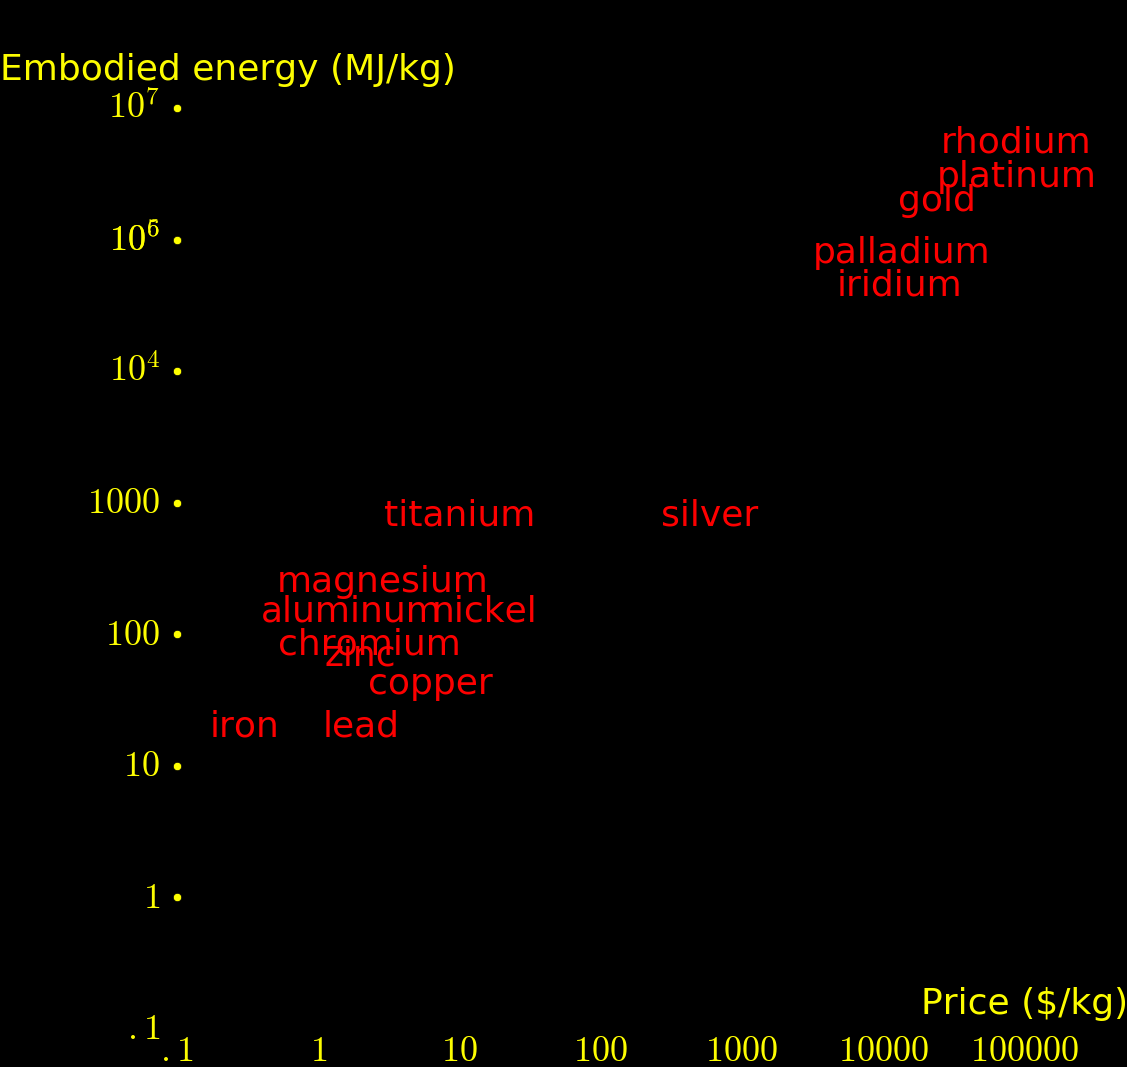
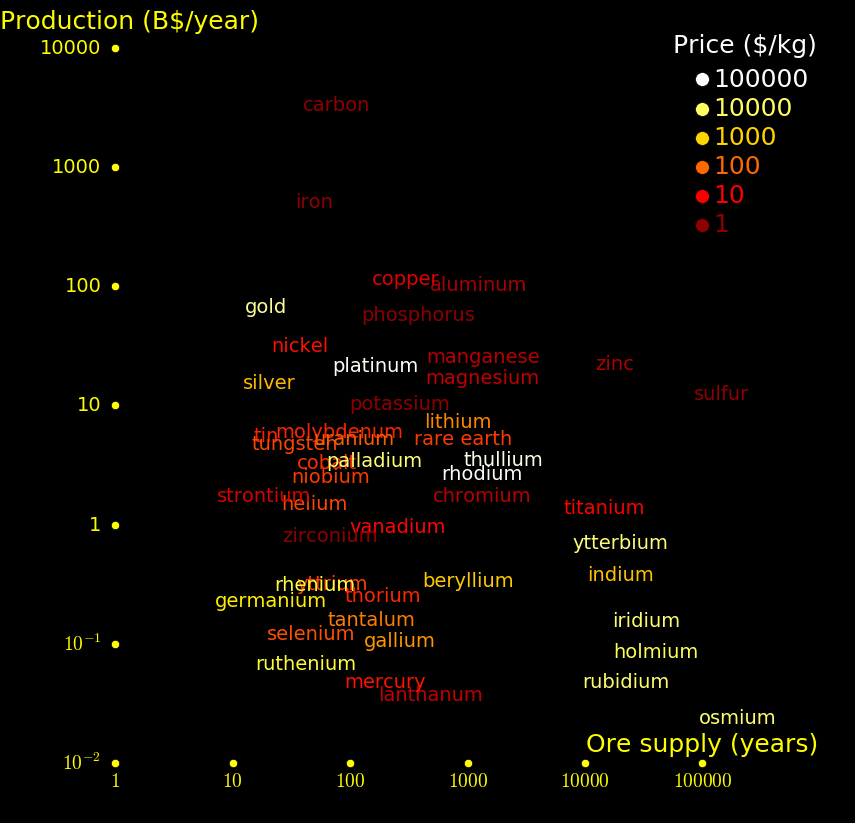
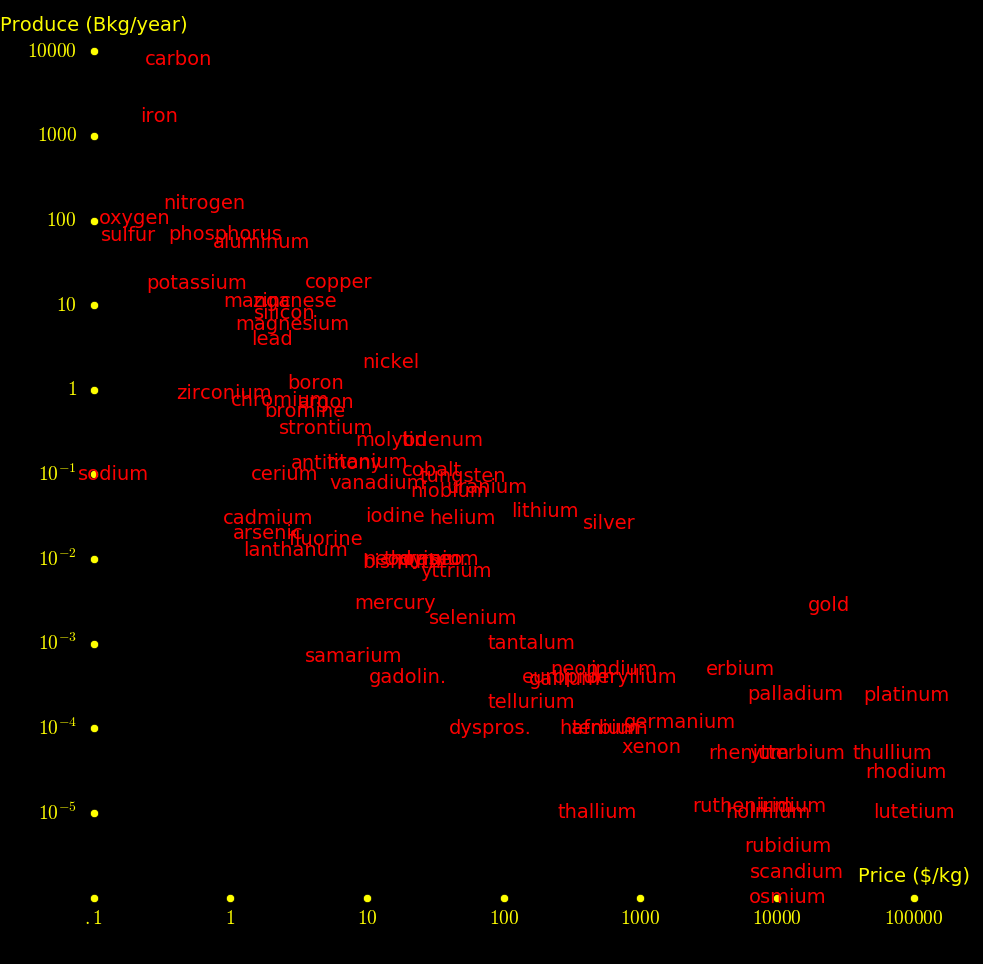
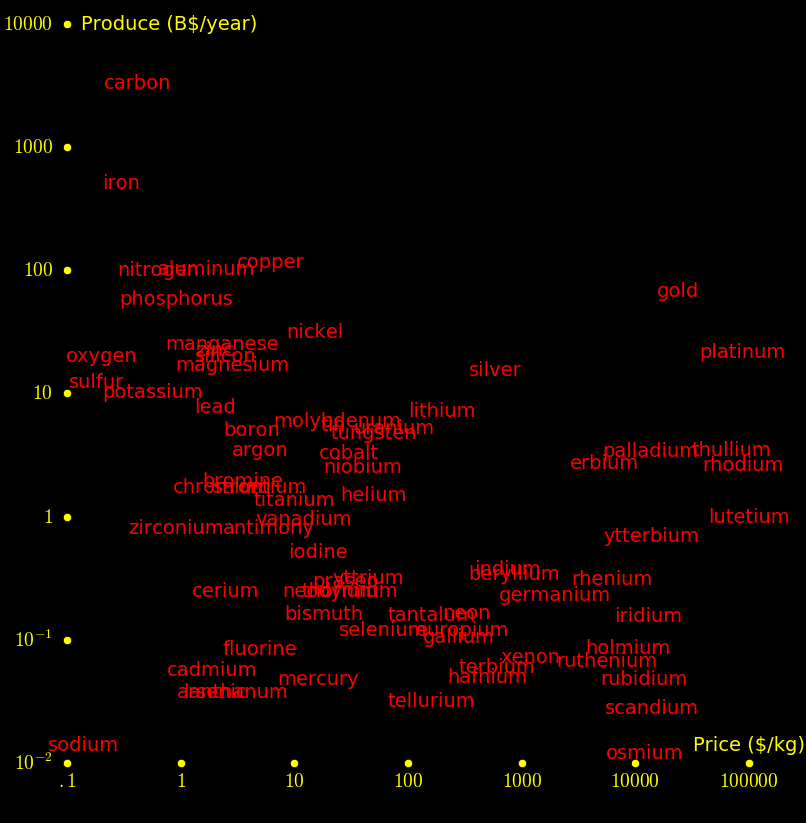
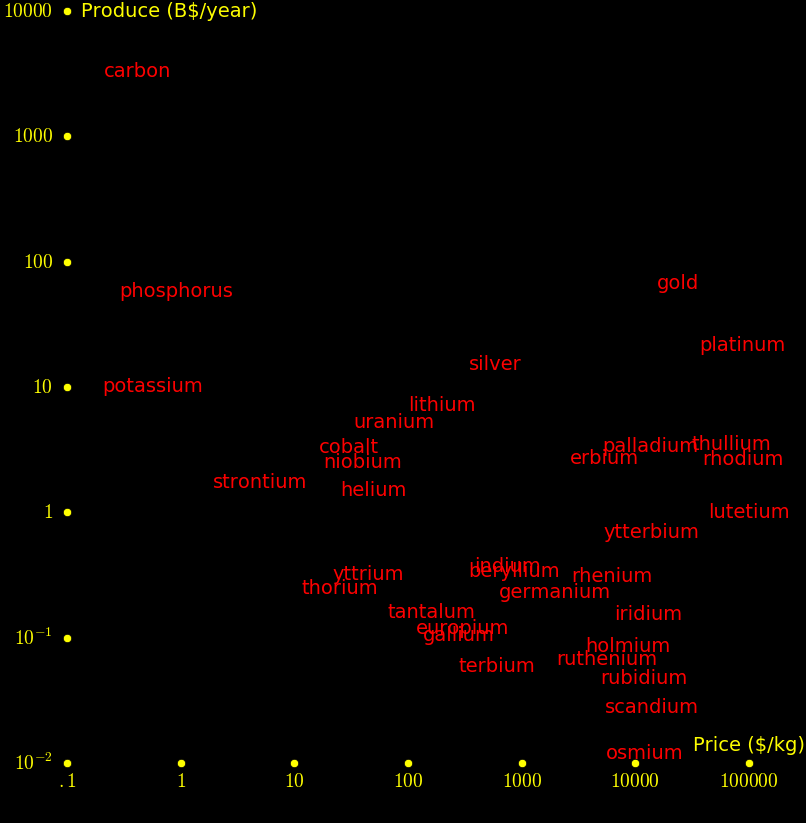
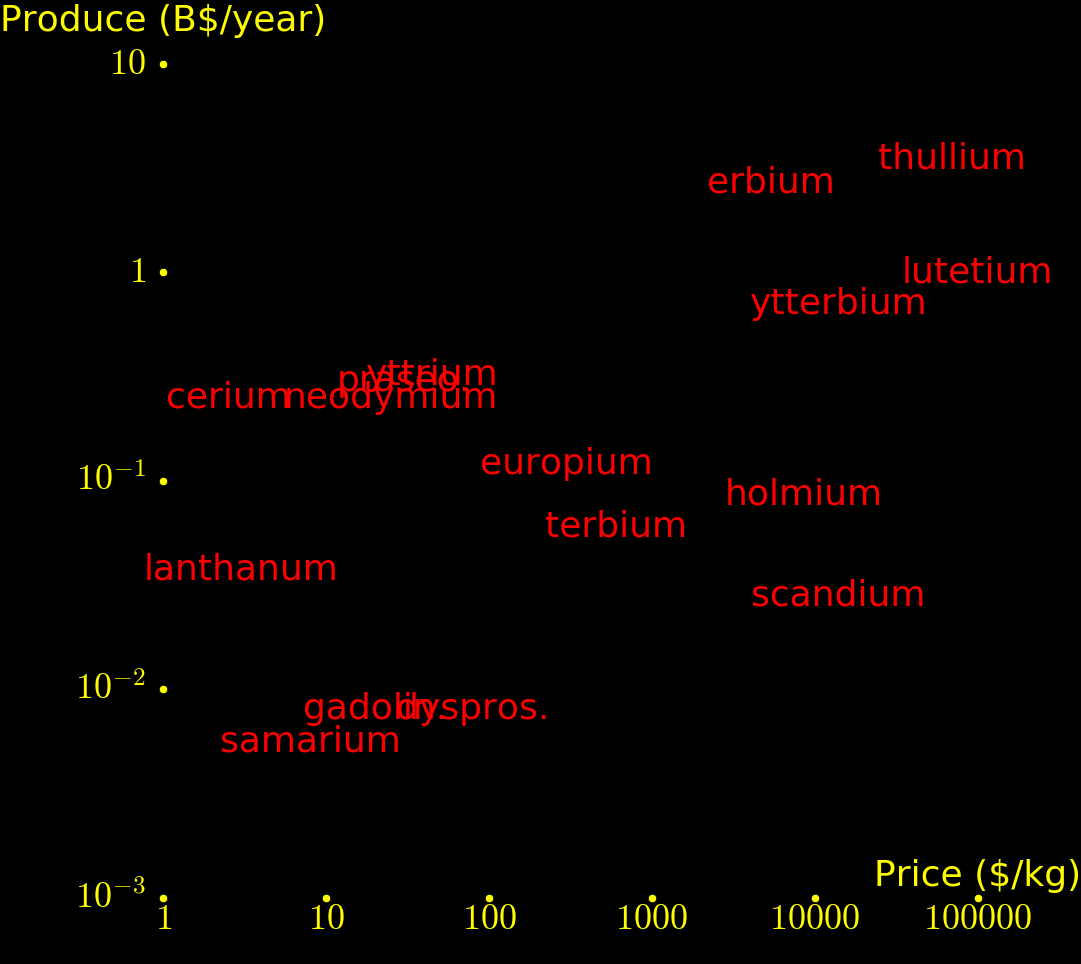
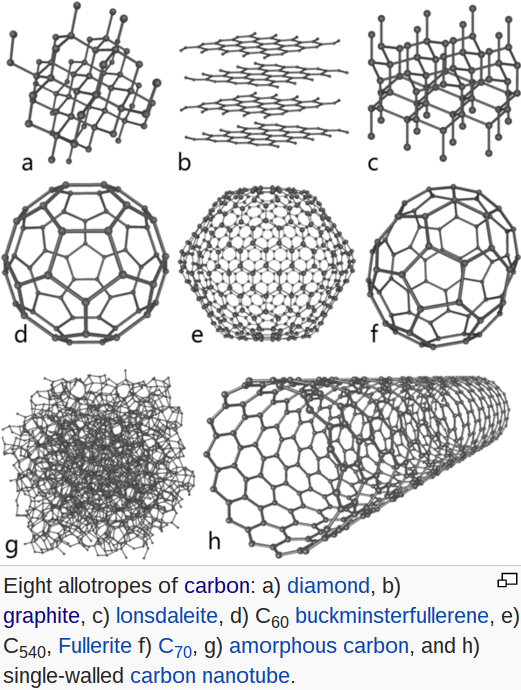
Appendix with more element plots
 |
|---|
 |
|---|
|
|---|
|
|---|
 |
|---|
 |
|---|
 |
|---|
 |
|---|
 |
|---|
 |
|---|
 |
|---|
 |
|---|
 |
|---|
|
|---|
 |
|---|
|
|---|
 |
|---|
 |
|---|
 |
|---|
 |
|---|
 |
|---|
 |
|---|
 |
|---|
 |
|---|
 |
|---|
 |
|---|
 |
|---|
 |
|---|
 |
|---|
 |
|---|
 |
|---|
 |
|---|
 |
|---|
 |
|---|
 |
|---|
|
|---|
 |
|---|
 |
|---|
 |
|---|
 |
|---|
 |
|---|
|
|---|
 |
|---|
|
|---|
 |
|---|
 |
|---|
 |
|---|
 |
|---|
 |
|---|
 |
|---|
 |
|---|
 |
|---|
 |
|---|
 |
|---|
 |
|---|
 |
|---|
 |
|---|
 |
|---|
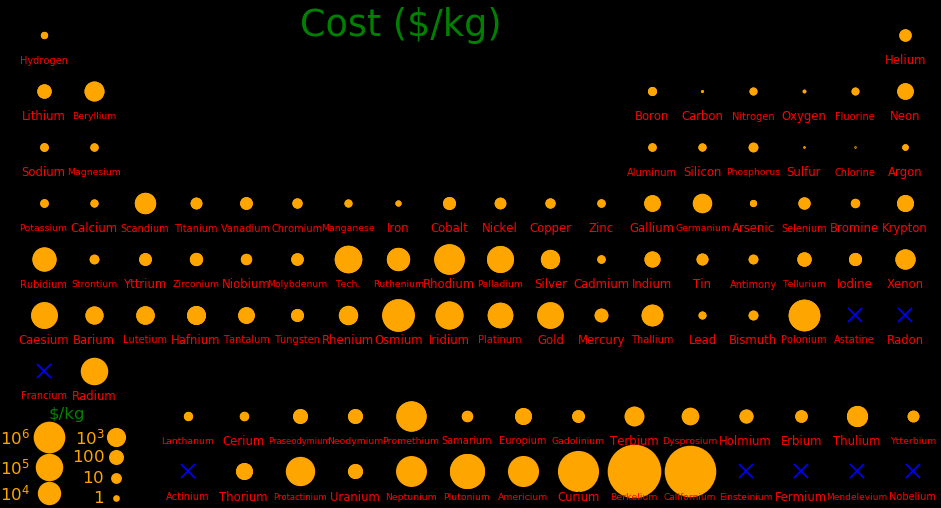
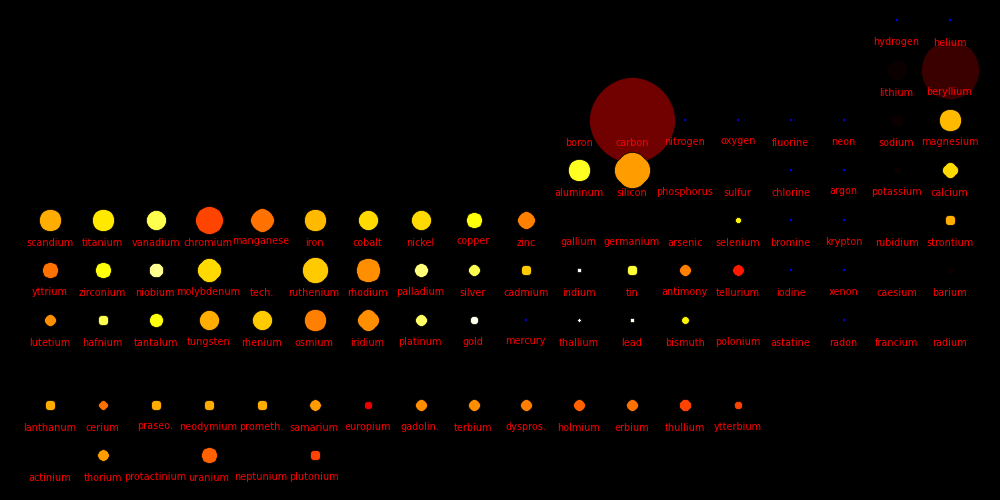
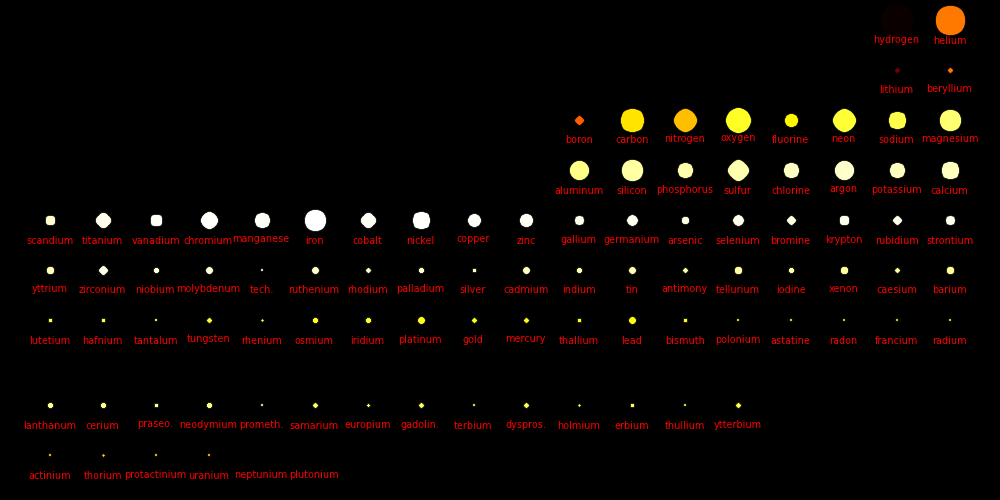
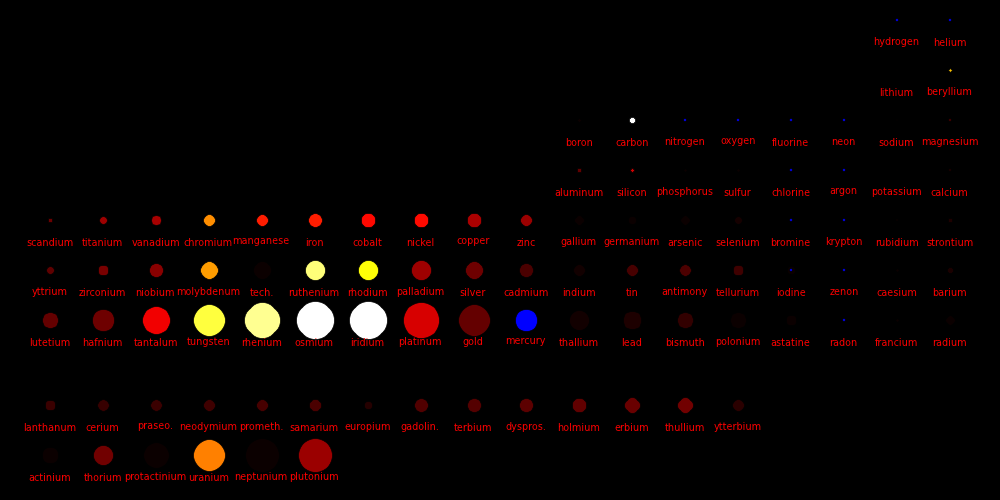
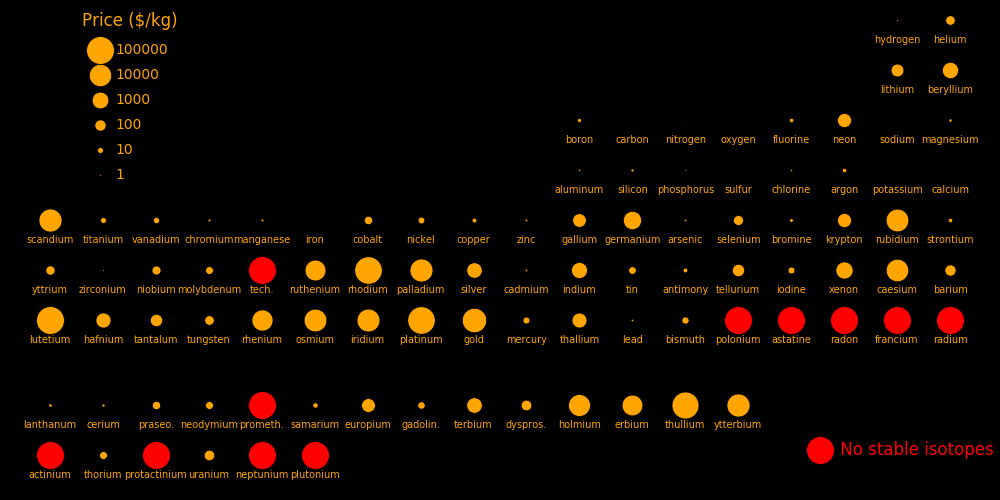
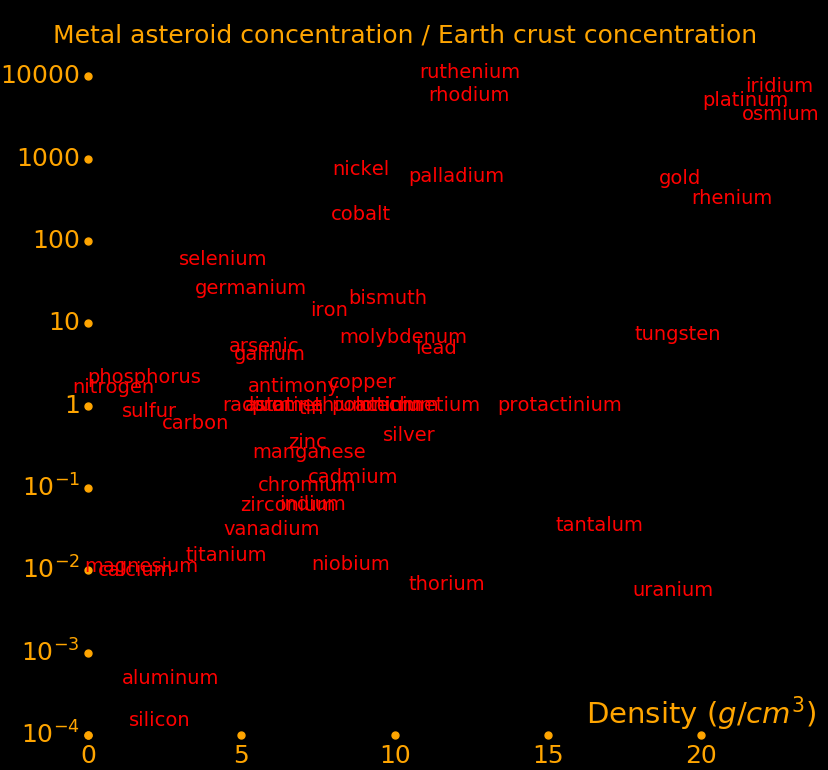
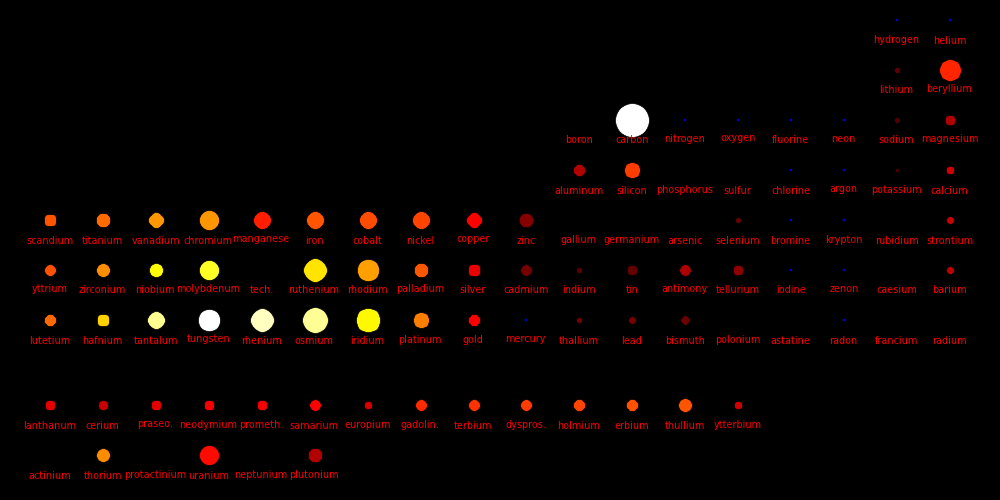
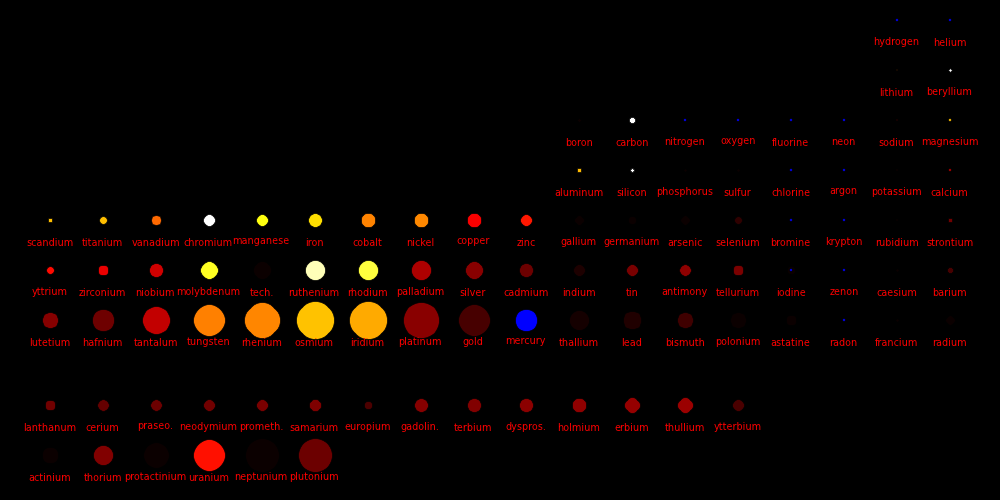
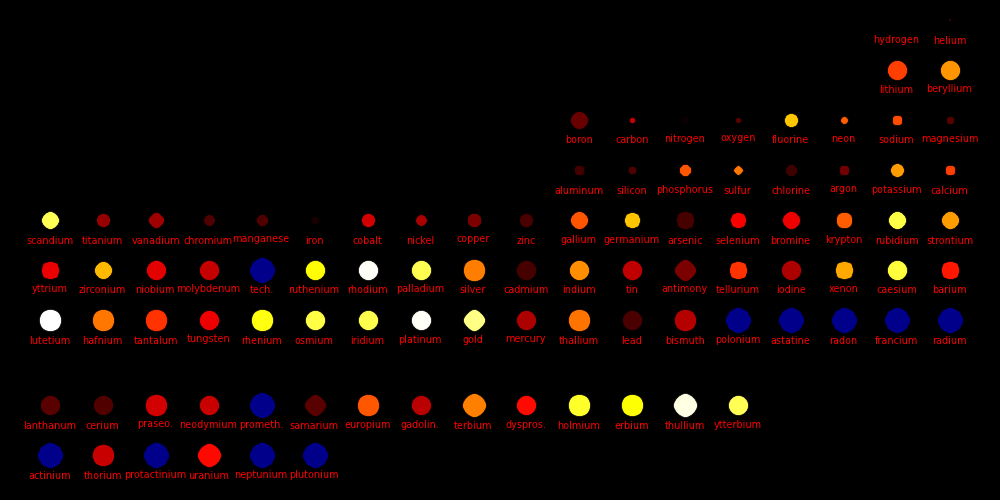
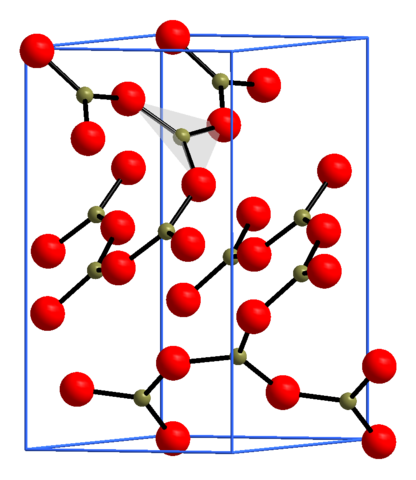
Dot size corresponds to atom size. For gases, the density at boiling point is used.
 |
 |
 |
 |
 |
||
|---|---|---|---|---|---|---|
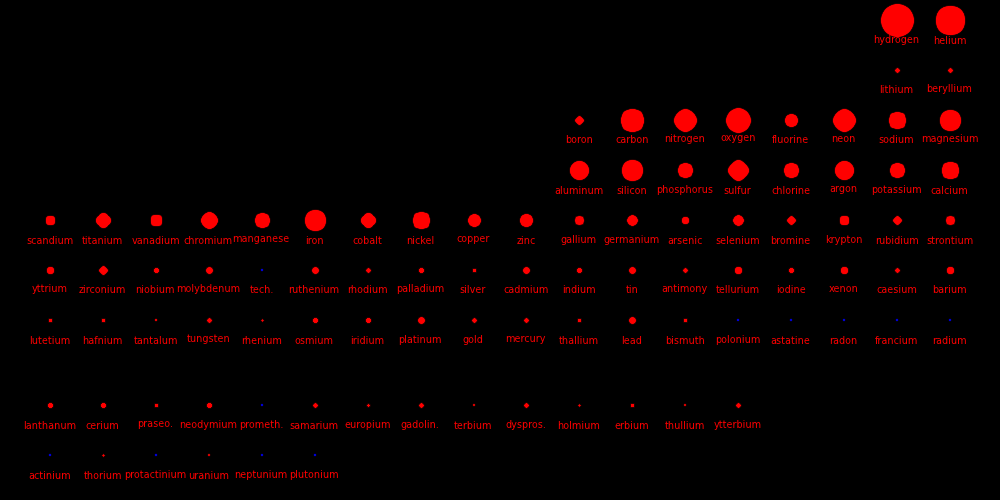
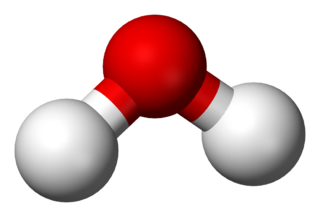
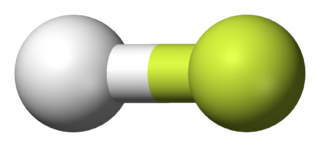
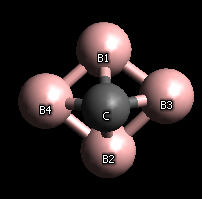
Hydrogen forms molecules with all elements except the noble gases, osmium, iridium, promethium, francium, and radium. This makes it a benchmark for determining the number of bonds that each element forms, as well as the strength of each element's attraction for electrons.
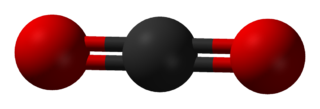
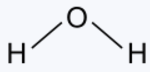
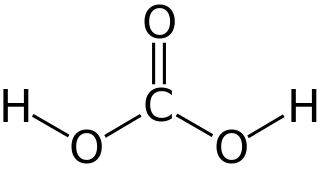
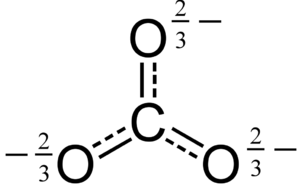
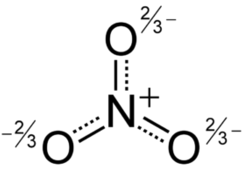
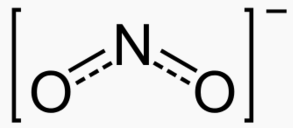
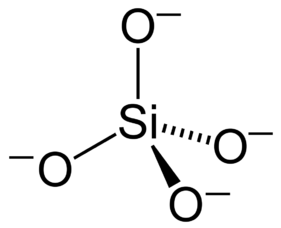
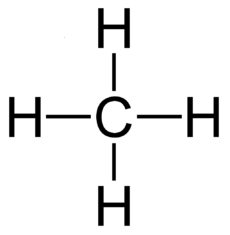
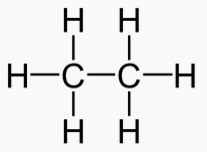
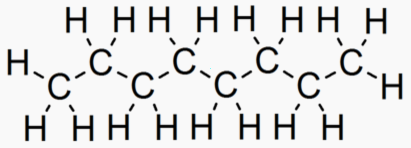
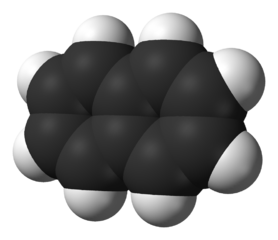
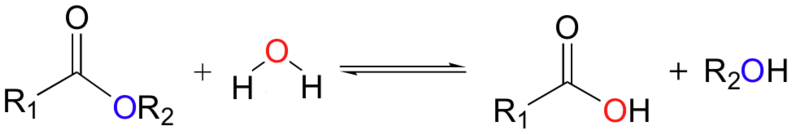
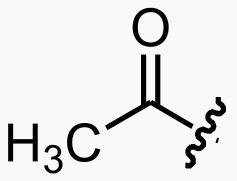
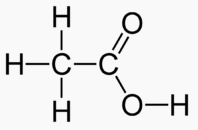
A molecule is organic if it contains carbon. Molecules are often depicted with
the hydrogens excluded.
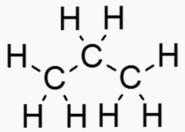
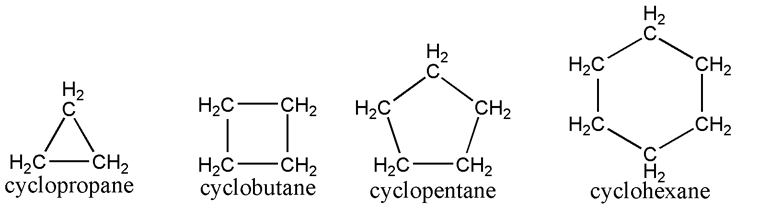
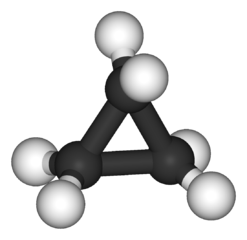
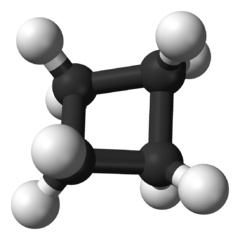
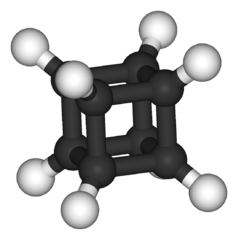
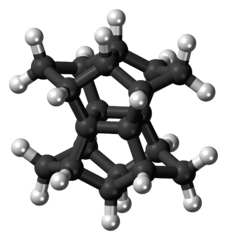
An "Alkane" is a carbon chain with hydrocarbons attached. At standard
temperature (300 K), alkanes are solid if they have more than 20 carbons. This
is why lipids (long alkanes) are the optimal form of energy storage. Short
alkanes are liquids or gases at STP and are hard to store.
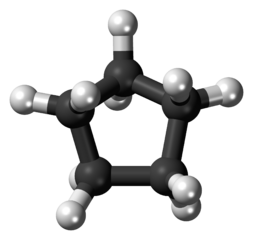
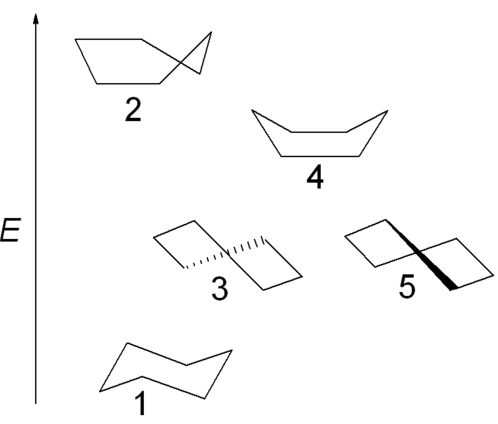
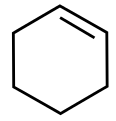
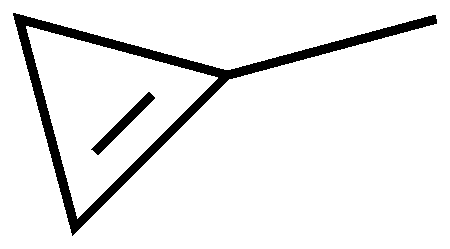
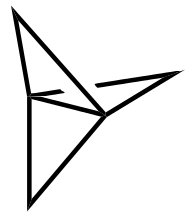
Cyclohexane comes in different conformations with different energies.
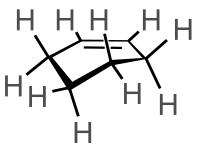
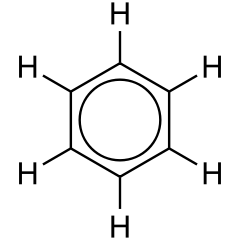
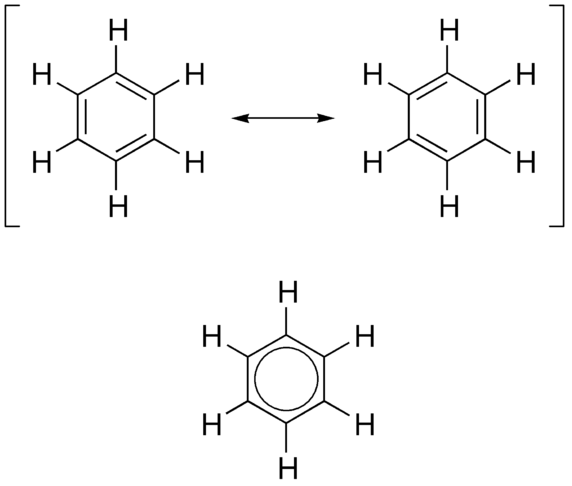
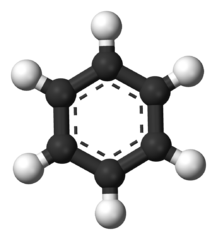
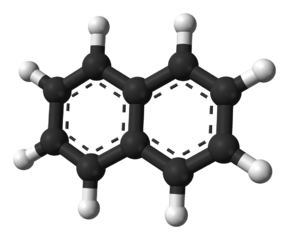
Benzine is a resonance molecule.
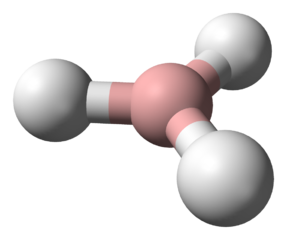
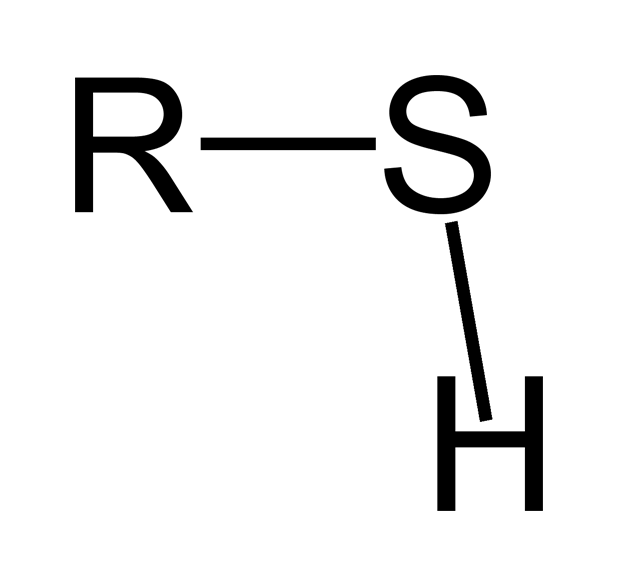
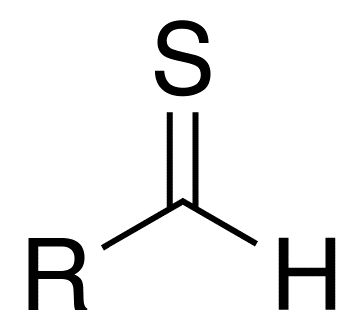
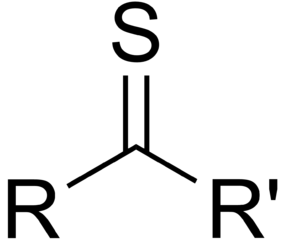
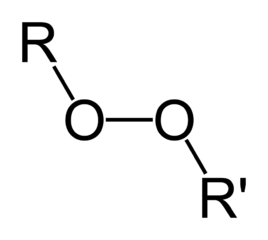
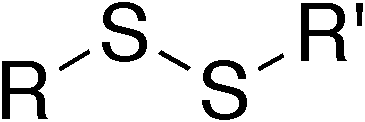
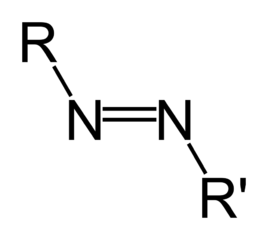
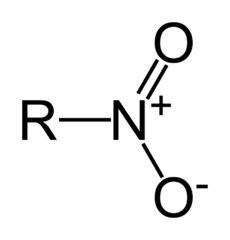
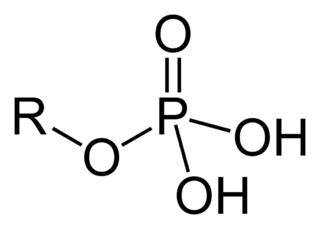
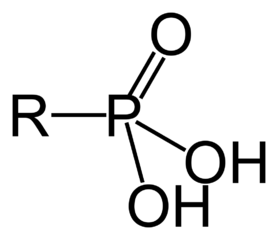
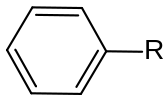
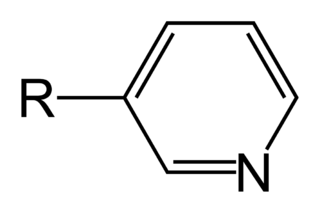
Organic molecules are classified by their functional group. "R" stands for
an arbitrary molecule.
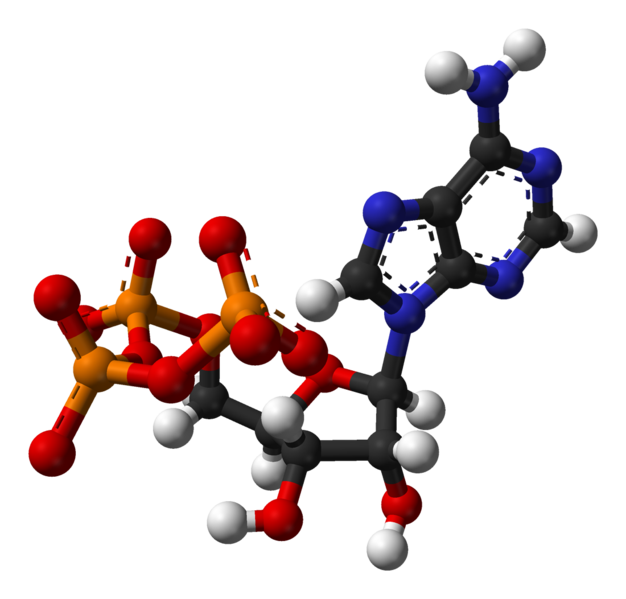
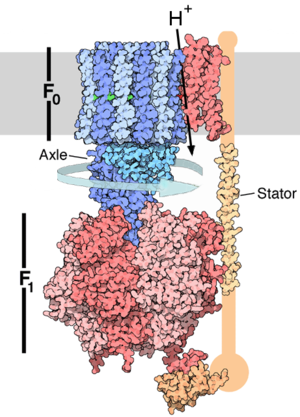
Enzymes use ATP as an energy source to power chemical reactions. ATP and ATP
synthase are common to all Earth life.
* Video of the ATP synthase enzyme in action
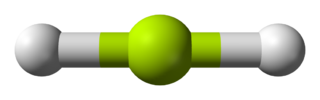
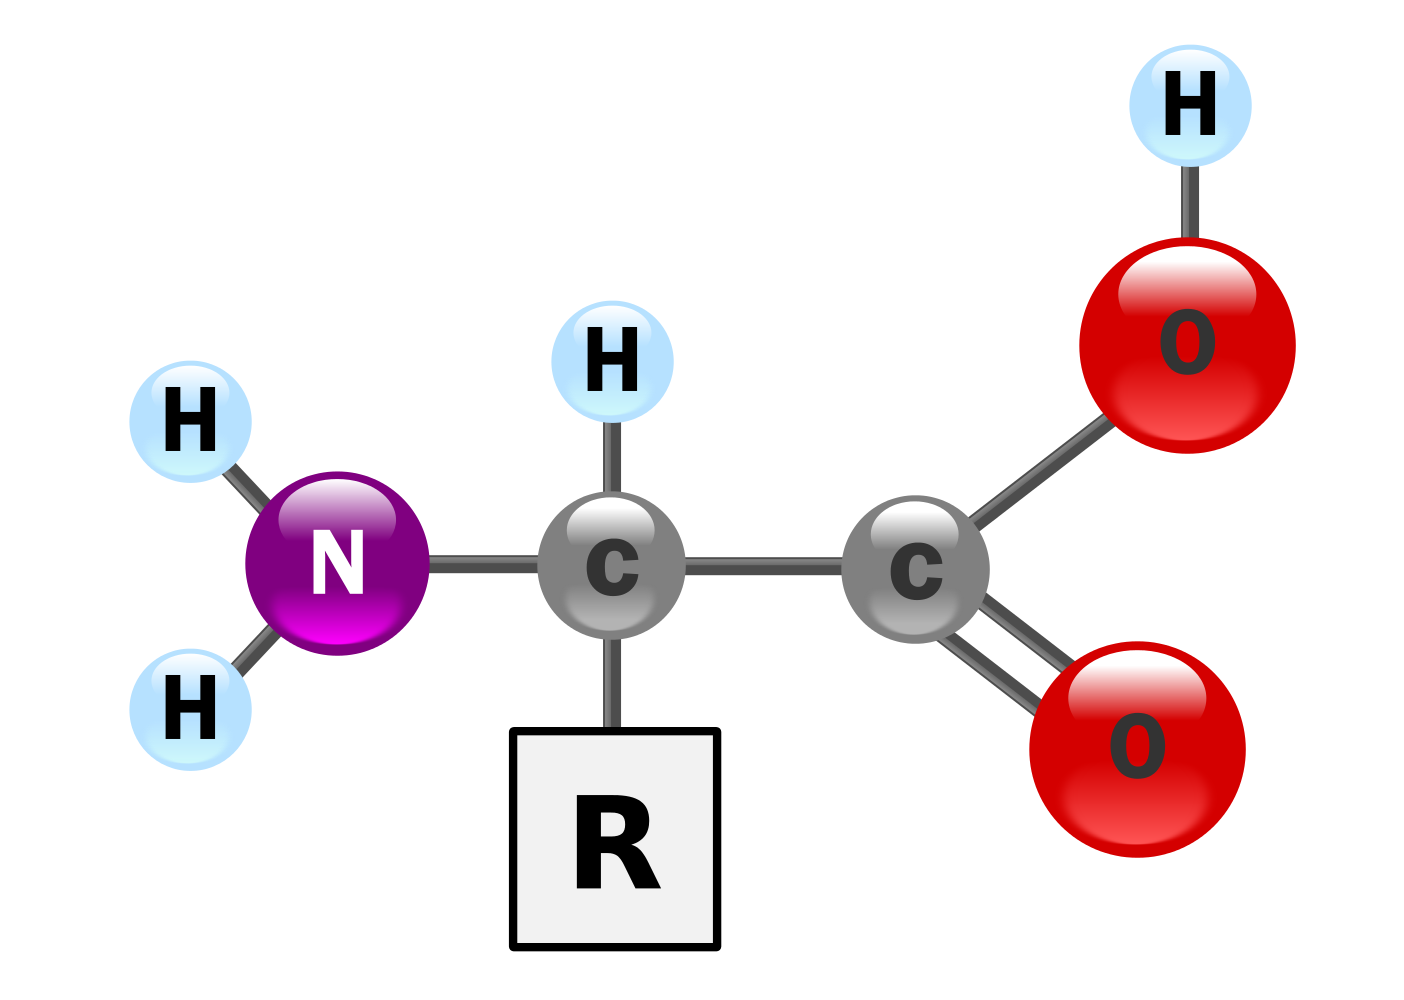
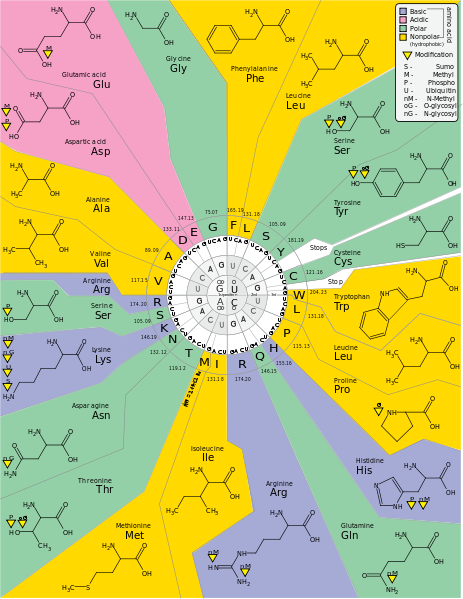
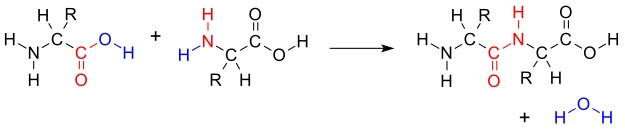
Amino acids have the above form, where R stands for an arbitrary molecule.
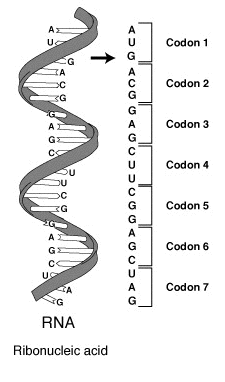
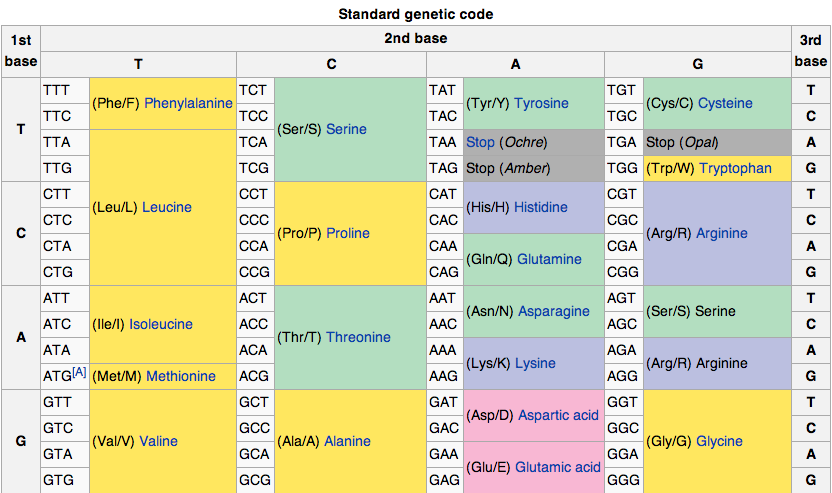
DNA codes a sequence of amino acids. The 64-element codon system is universal to
Earth life.
The codon ATG both codes for methionine and serves as an initiation site: the
first ATG in an mRNA's coding region is where translation into protein begins.
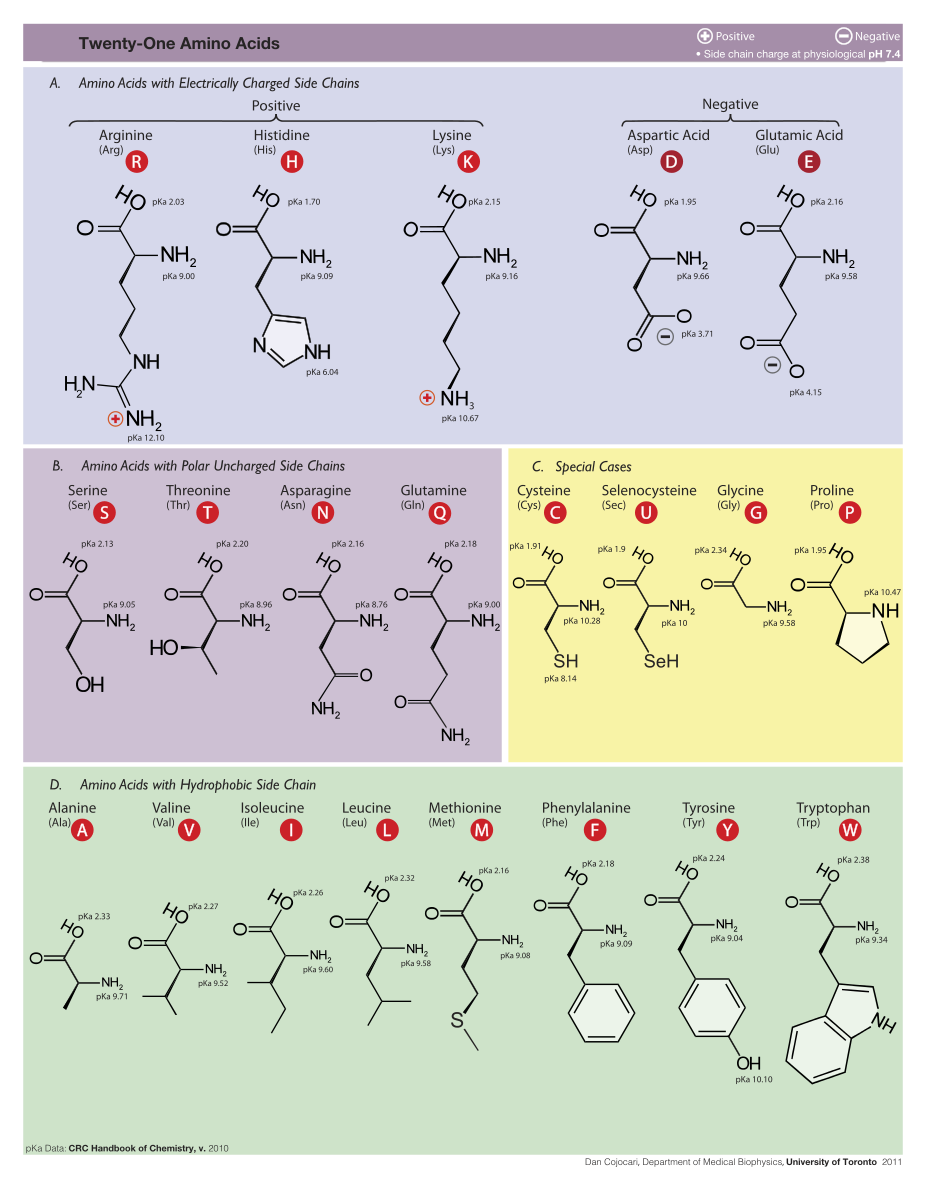
21 amino acids are used by eucaryote. More than 500 amino acids are known.
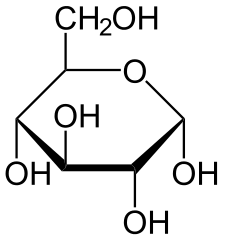
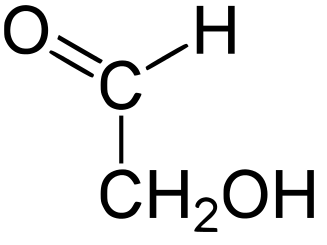
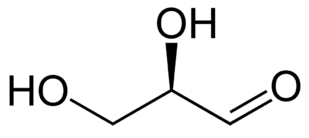
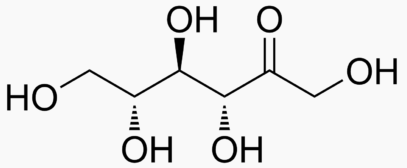
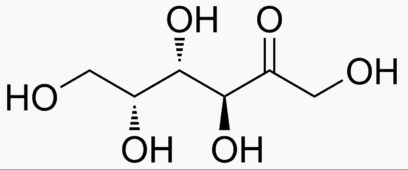
A sugar generally has the formula CN H2N ON, where
N = 2, 3, etc. The common sugars are hexoses with N=6.
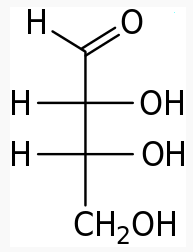
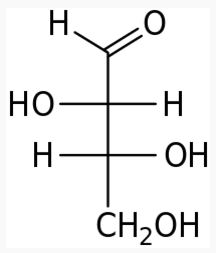
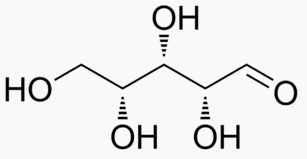
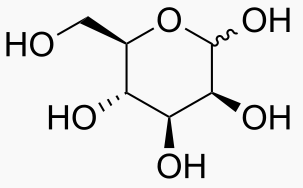
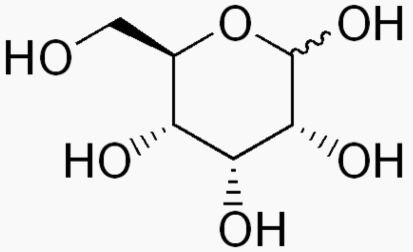
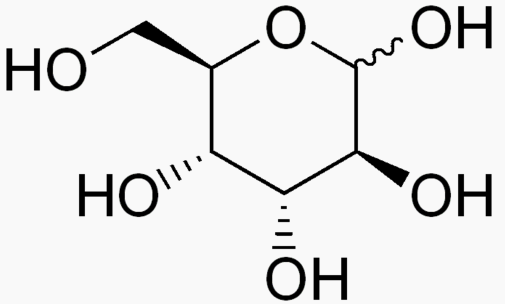
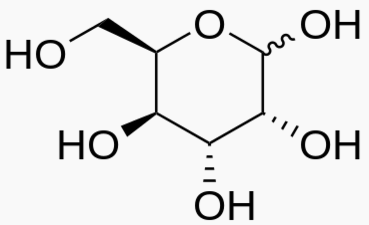
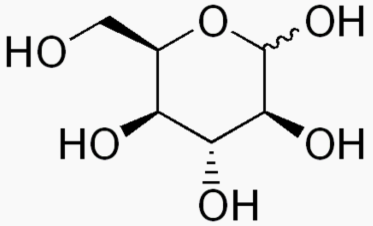
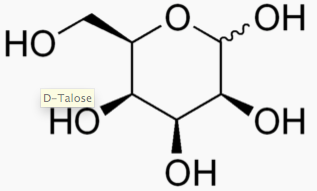
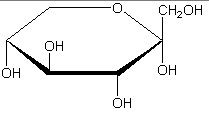
Each sugar molecule has two mirror-symmetric forms, the "D" and "L" form. Only the D forms
are found in nature.
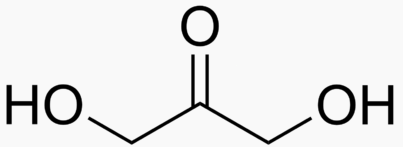
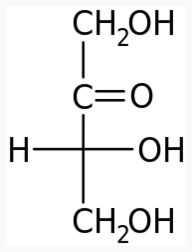
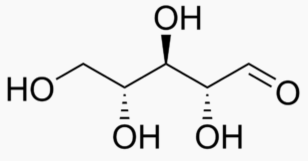
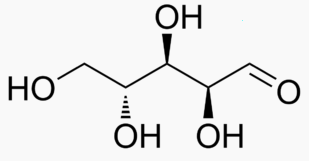
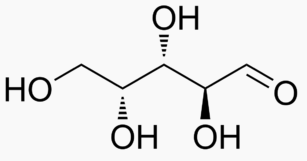
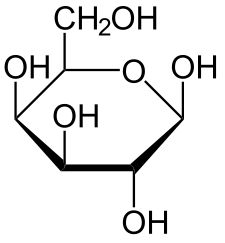
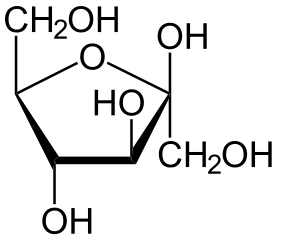
The following figures show all sugars up to 6 carbons. All can be metabolized by humans.
2 carbons:
3 carbons:
4 carbons:
5 carbons:
6 carbons:
Fatty acids and sugars are metabolized in the following stages, with each stage
yielding energy.
Blood delivers fatty acids to cells.
The citric acid cycle (Krebs cycle) converts acetyl or pyrovate into H2O and CO2.
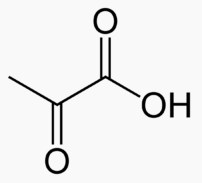
Coenzyme-A carries the acetyl around.
A fat molecule is converted into a fatty acid by lipolysis, and then the fatty acid is converted
into acetyl by beta oxydation, and then the acetyl is converted into H2O and CO2
by the citric acid cycle.
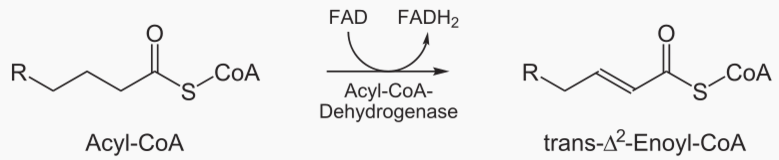
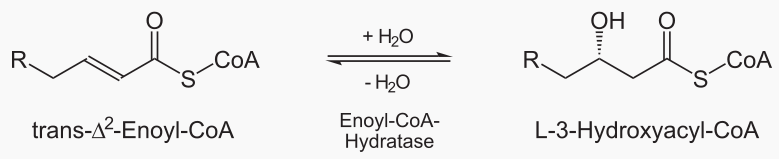
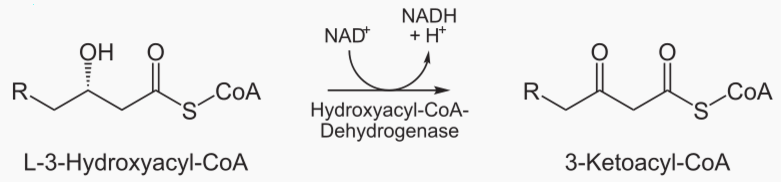
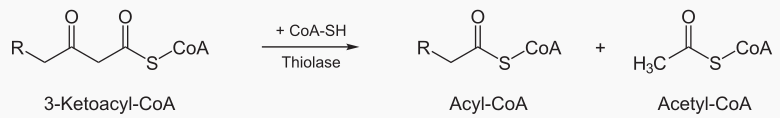
Beta oxidation cleaves 2 carbons from a fatty acid, which becomes acetyl. This process is repeated
until te entire fatty acid has been converted into acetyls.
The steps of beta oxidation are:
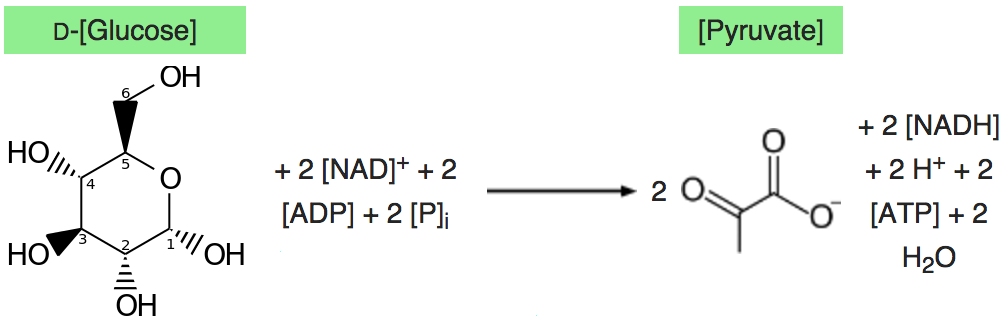
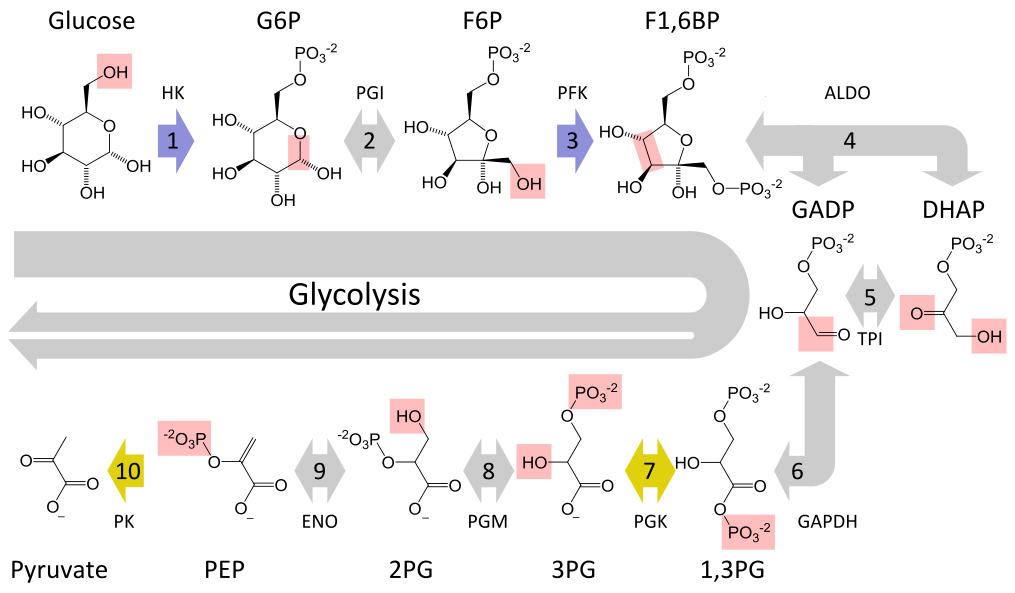
Glycolysis converts a glucose molecule into 2 pyrovate molecules. A summary of the reaction showing only
the starting and ending points is:
The full reaction is:
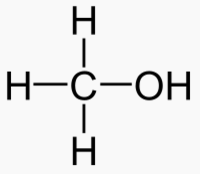
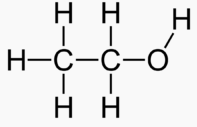
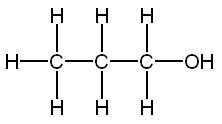
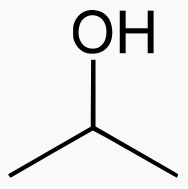
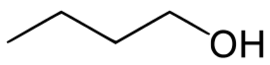
An alcohol is a carbon chain with one OH attached.
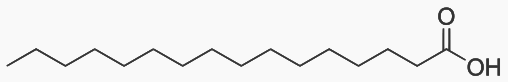
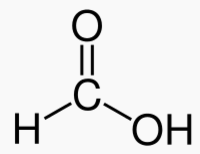
Palmitic acid has 16 carbons and is the most common fatty acid found in food.

![]()
![]()


-skeletal.png)


.png)


![]()
Synthesis of two amino acids. Proteins are chains of animo acids with a backbone of
the form:
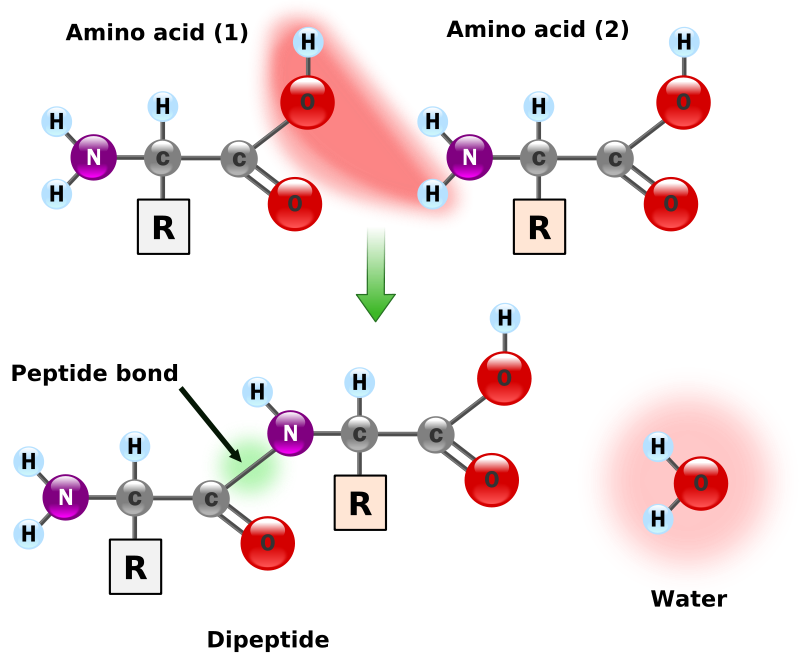
C-C-N-C-C-N-C-C-N-C-C-N-C-C-N
         Number of   Number of
          carbons     sugars
Diose        2          1
Triose       3          2
Tetrose      4          3
Pentose      5          4
Hexose       6         12       At least 6 carbons are required to form a ring
Heptose      7       many       Rarely observed in nature
Octose       8       many       Unstable.  Not observered in nature.
"Number of sugars" refers to the number of different types of sugar molecules for each
carbon number.
         Energy  Sweetness

Succrose   1.00    1.00      Benchmark
Glucose             .74
Maltose             .32
Galactose           .32
Lactose             .16
Allose
Altrose
Mannose
Fructose           1.73
Psichose            .70
Tagatose    .38     .92
Sorbose            1.0
Honey               .97
Monosaccharde: 1 sugar molecule
Disaccharide: 2 monosaccharides
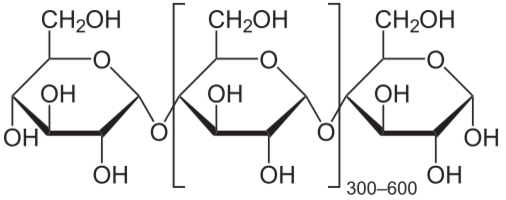
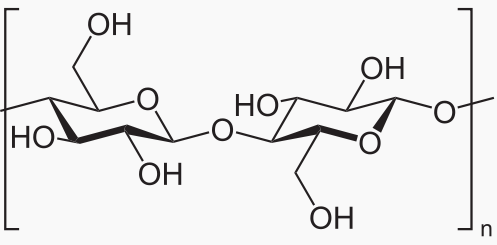
Polysaccharide: More than 2 monosaccharides, such as starch and cellulose
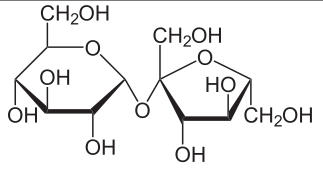
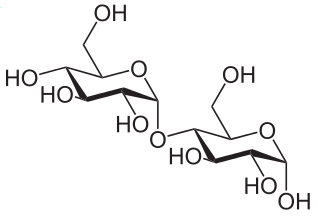
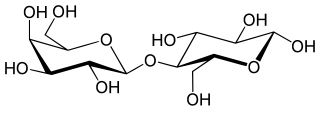
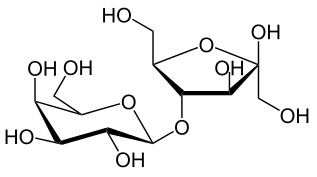
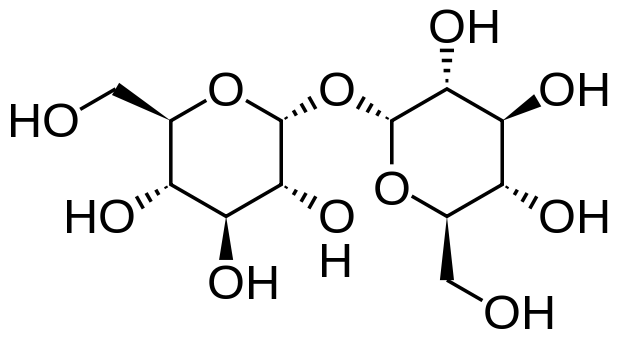
Sucrose    =  Glucose     + Fructose
Maltose    =  Glucose     + Glucose
Lactose    =  Galactose   + Glucose
Lactulose  =  Galactoce   + Fructose
Trehalose  =  Glucose     + Glucose
Cellobiose =  Glucose     + Glucose
Chitobiose =  Glucosamine + Glucosamine
Starch and cellulose are long chains of glucose molecules.
![]()
Fatty acid    →     Acetyl      →     CO2 and H2O

Sugar         →     Pyruvate    →     CO2 and H2O
          Carbons
Methanol     1       Toxic
Ethanol      2       Inebriating
Propanol     3       3 times more inebriating than ethanol
Isopropanol  3       Toxic
Butanol      4       6 times more inebriating than ethanol
Carbons
   1
   2    Vinegar
   3
   4    Found in butter
   8    Found in coconuts
  10    Found in coconuts
  12    Found in coconuts
  16    Most common fatty acid.  Found in palm oil
  18    Found in chocolate
  20    Found in peanut oil
![]()
© Jason Maron, all rights reserved.
Data from Wikipedia unless otherwise specified.