
|
|
|
|
|
|
|---|---|---|---|---|---|
 |
 |
 |
 |
 |
 |
 |
|---|---|---|---|---|---|---|
 |
 |
 |
 |
|
|---|---|---|---|---|
 |
 |
 |
 |
 |
 |
 |
|---|---|---|---|---|---|---|
 |
 |
 |
 |
|
|---|---|---|---|---|
 |
|---|
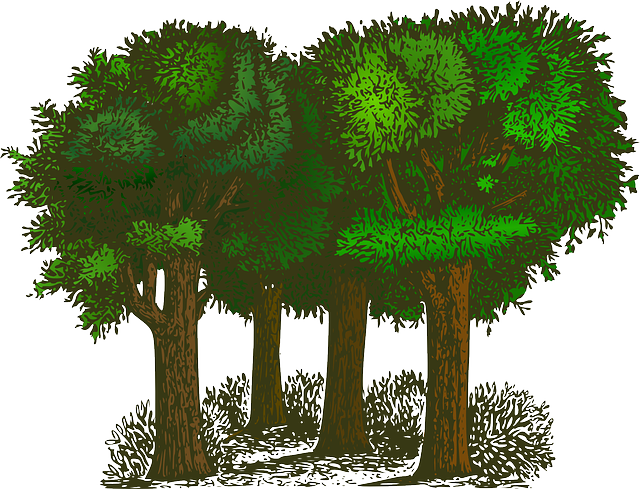
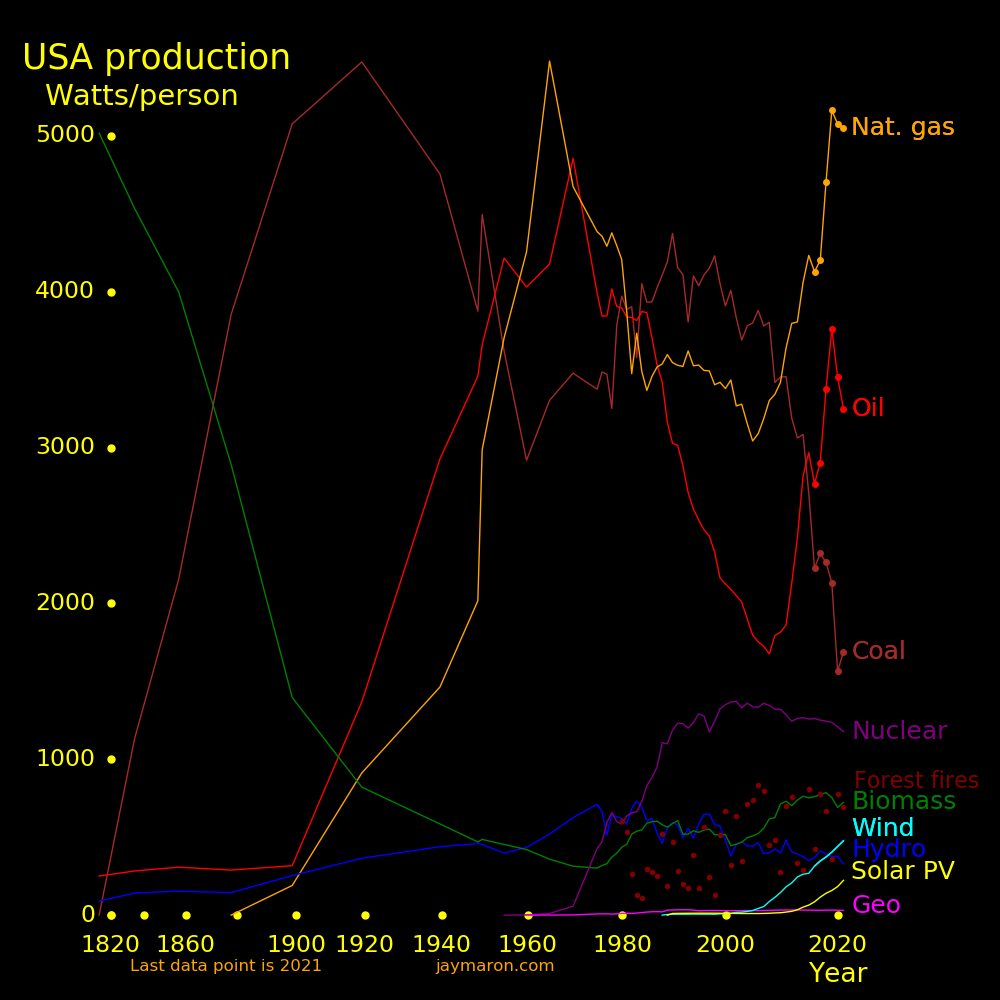
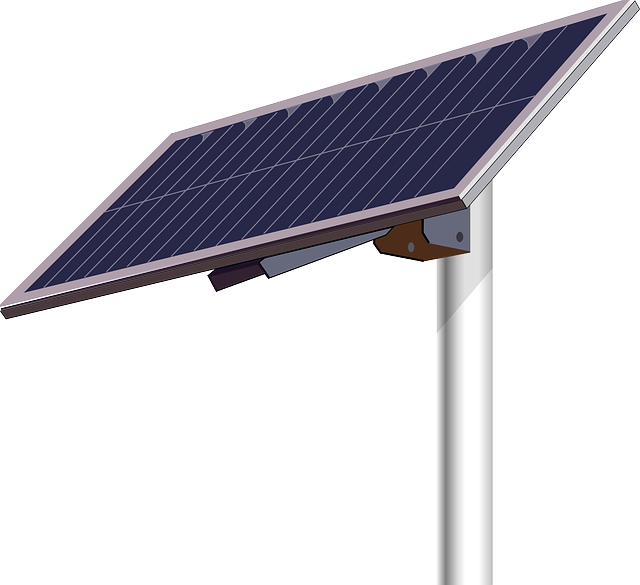
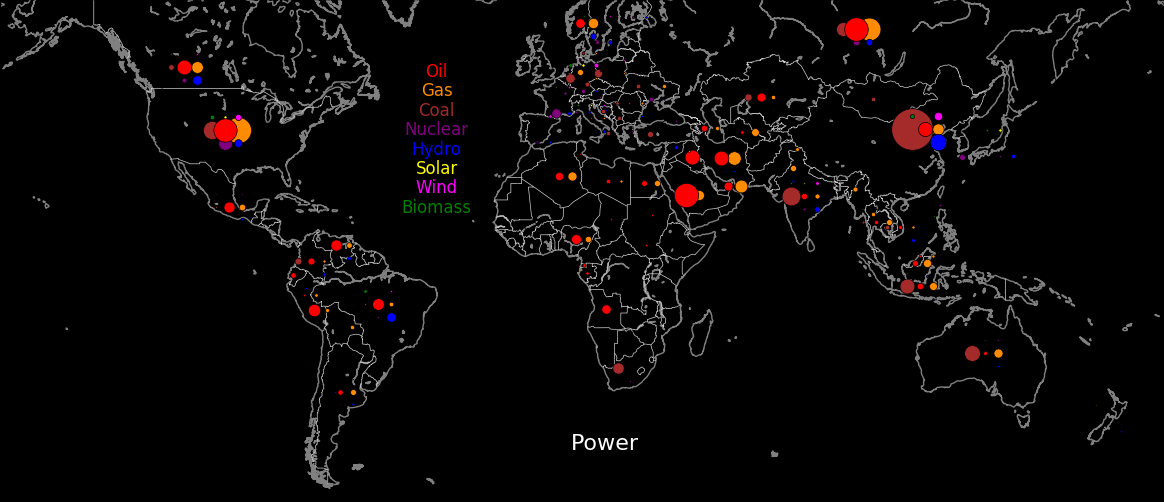
For energy expansion, the best near-term options are biomass and nuclear. Hydro is maxed out, solar and wind are growing too slowly, and tidal and geothermal are too feeble. The energy lost to forest fires is substantial and can be harnessed.
The best energy source is all of them, and as much as possible from each. Make energy abundant and cheap.
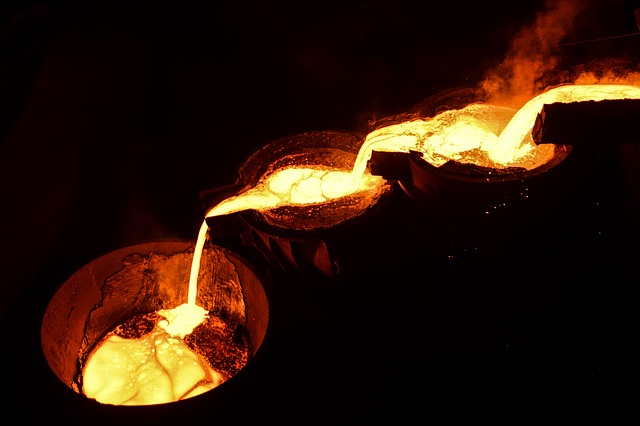
Each energy source has a niche. Coal is for smelting metal, natural gas is for hydrogen production, and gasoline is for engines.
The best way to harness biomass energy is with trees, and trees can also capture carbon.
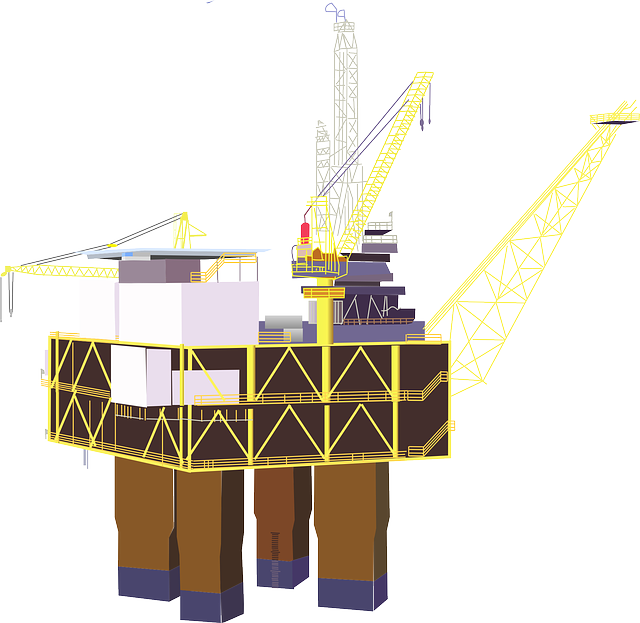
A nuclear reactor provides "high heat" (~ 925 Celsius) for producing electricity and chemicals. Reactors can also create precious metals and isotopes with neutron transmutation. A reactor's discard heat can heat a town. Radioactive waste contains valuable catalysts such as palladium and rhodium. New reactors have safety features that make meltdowns impossible. Portable reactors are easily installed and de-installed.
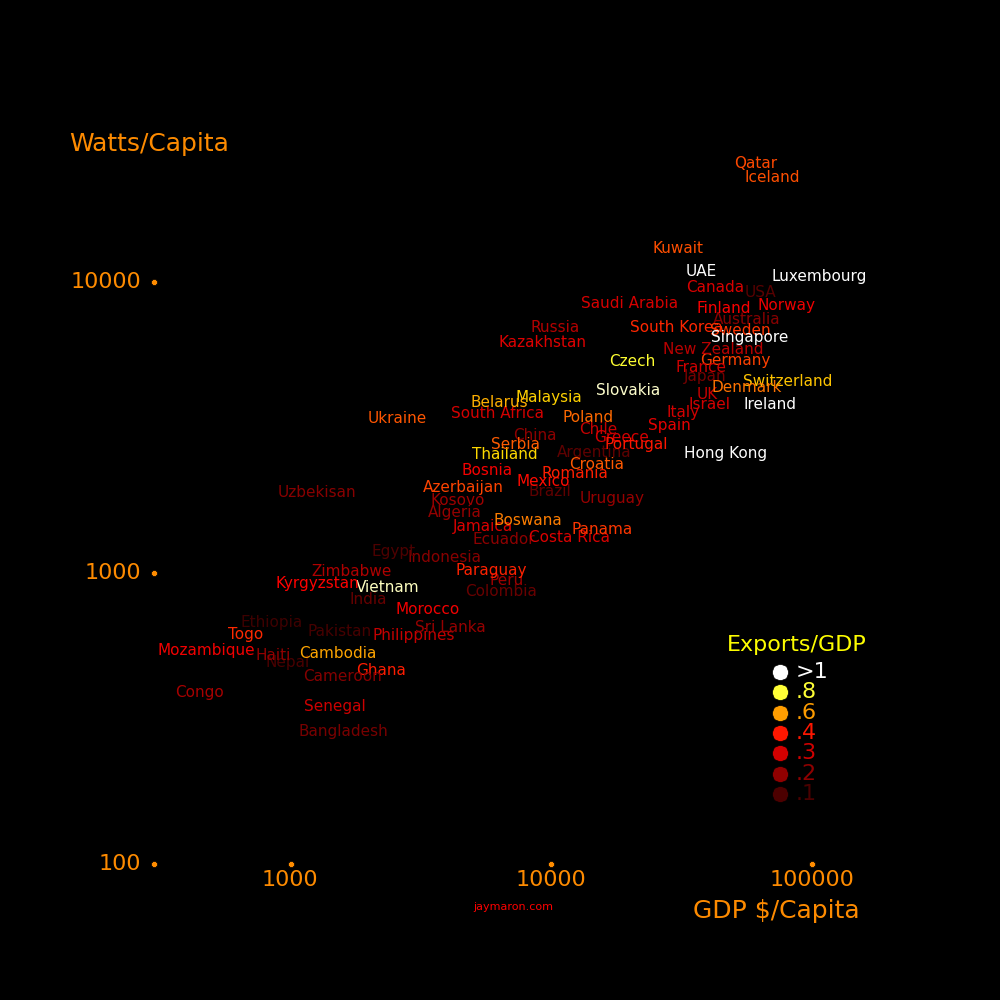
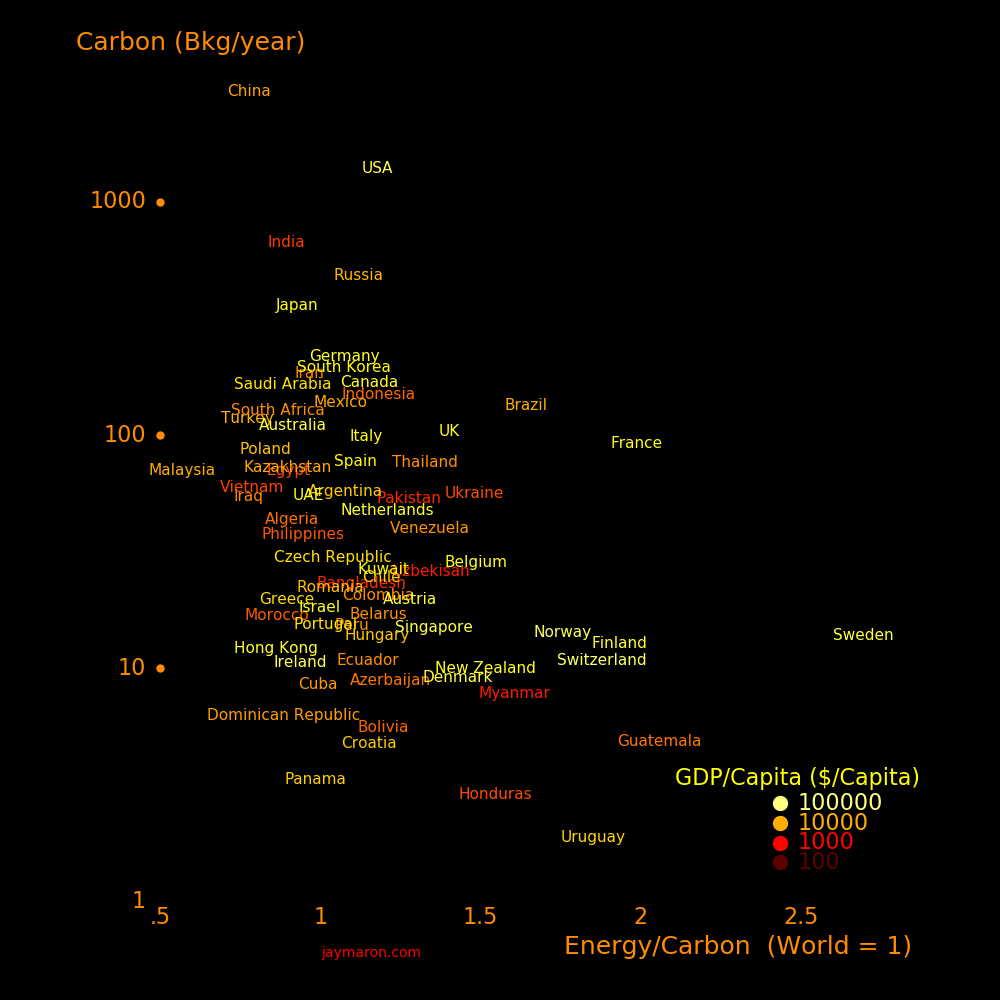
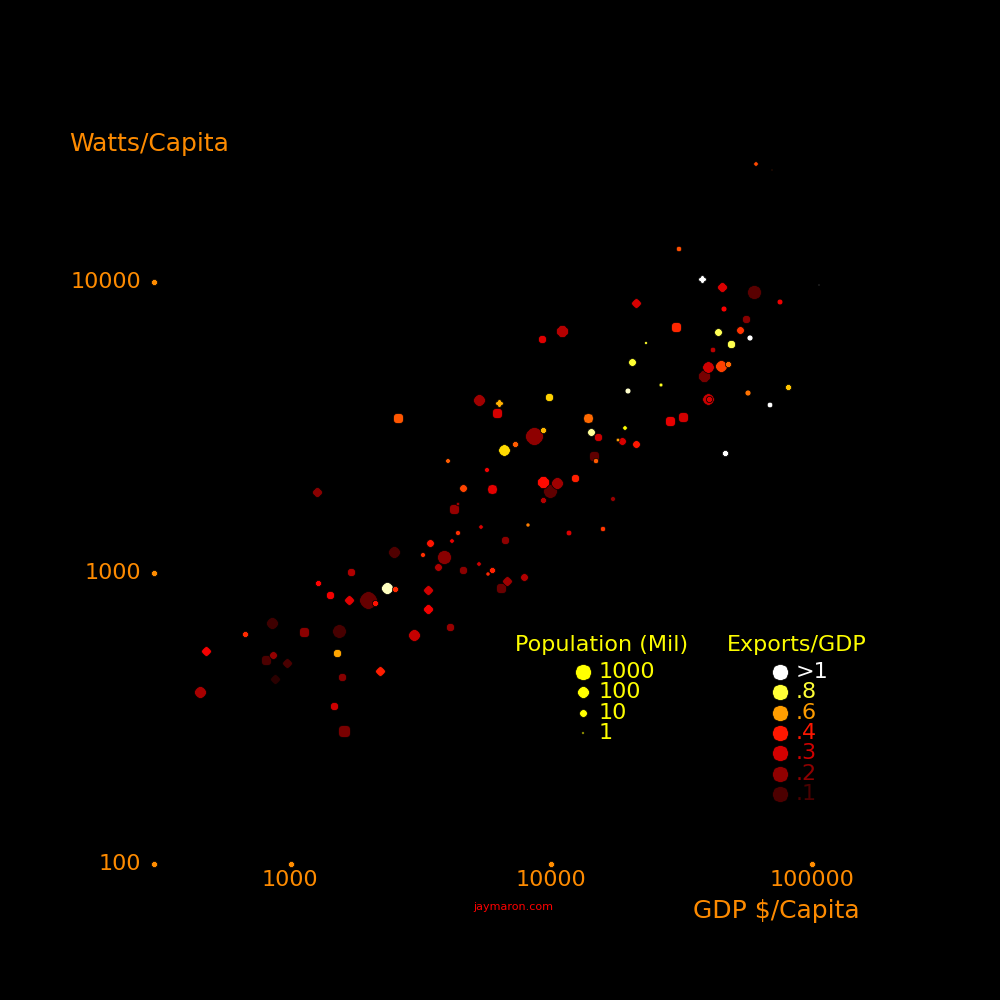
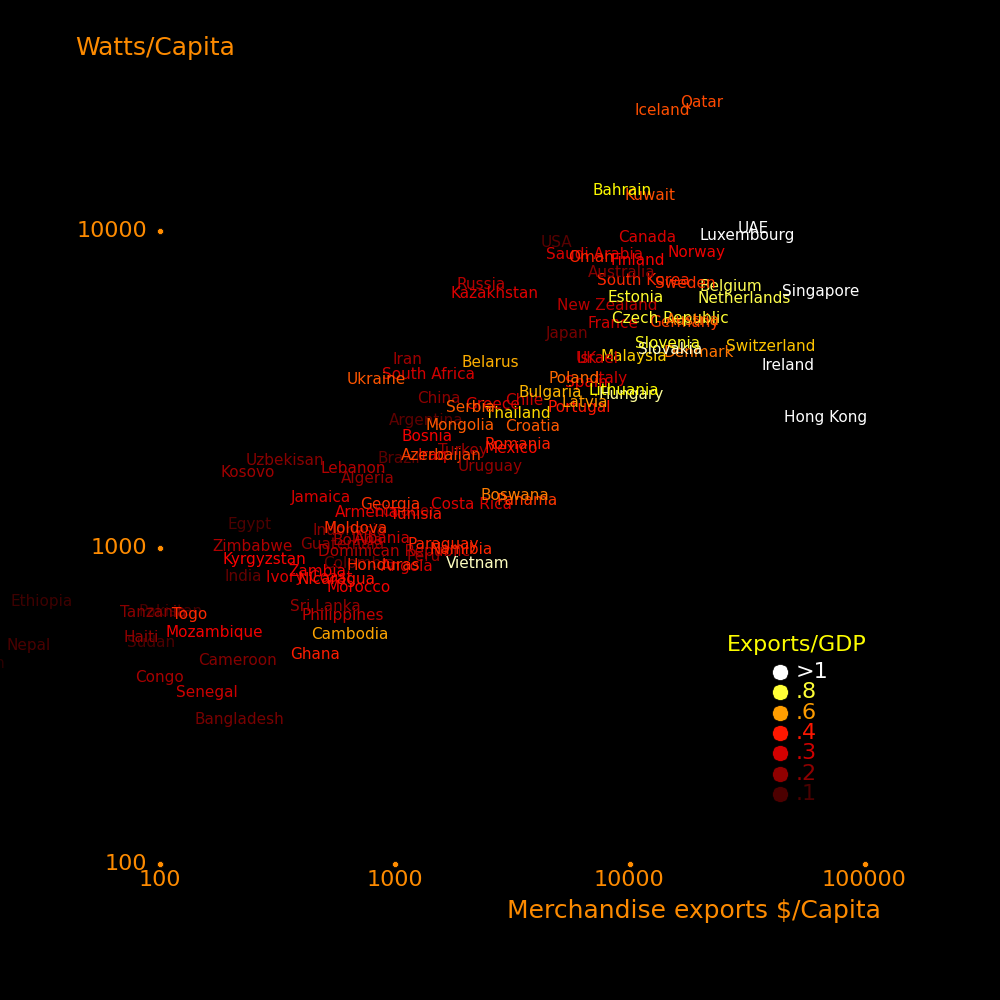
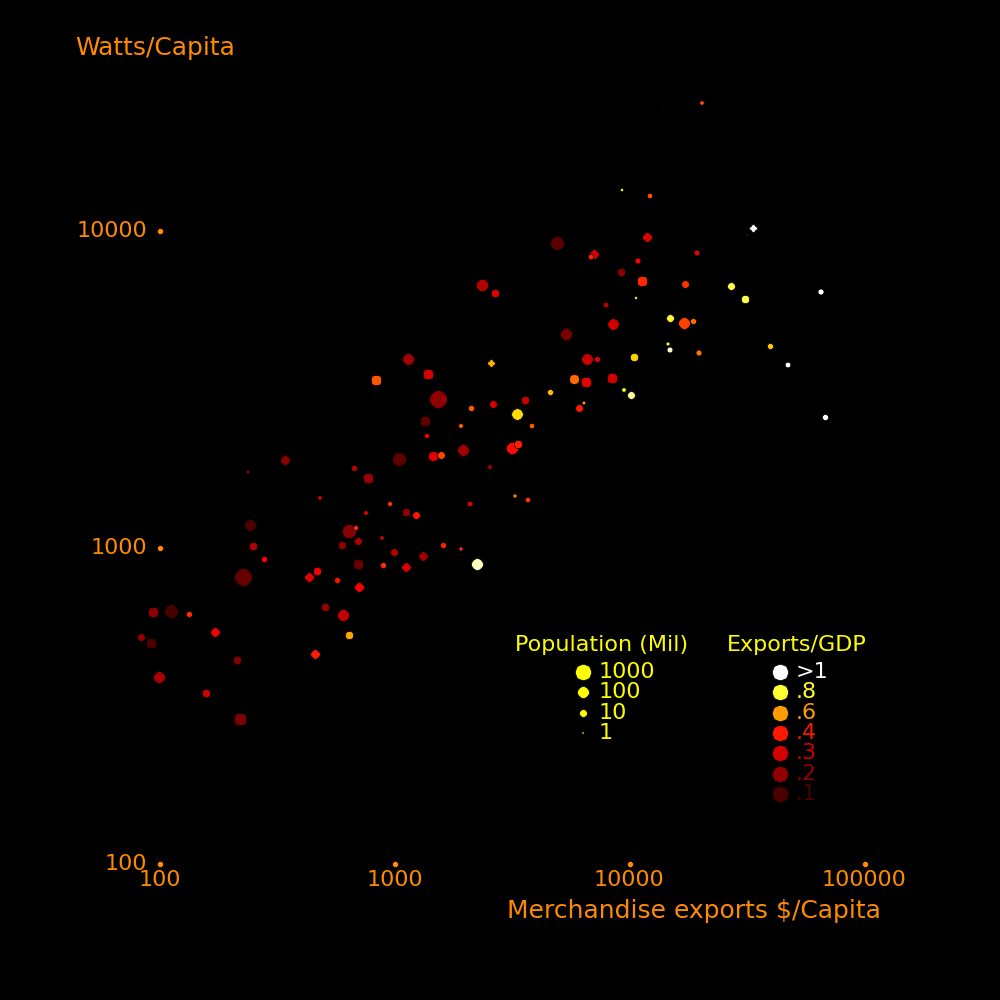
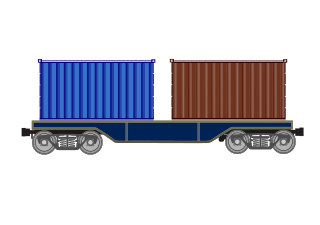
Energy is wealth. A nation's power consumption is tightly correlated with GDP.
 |
|---|
Energy → Primary materials → Manufacturing → Exports → Wealth
 |
|---|
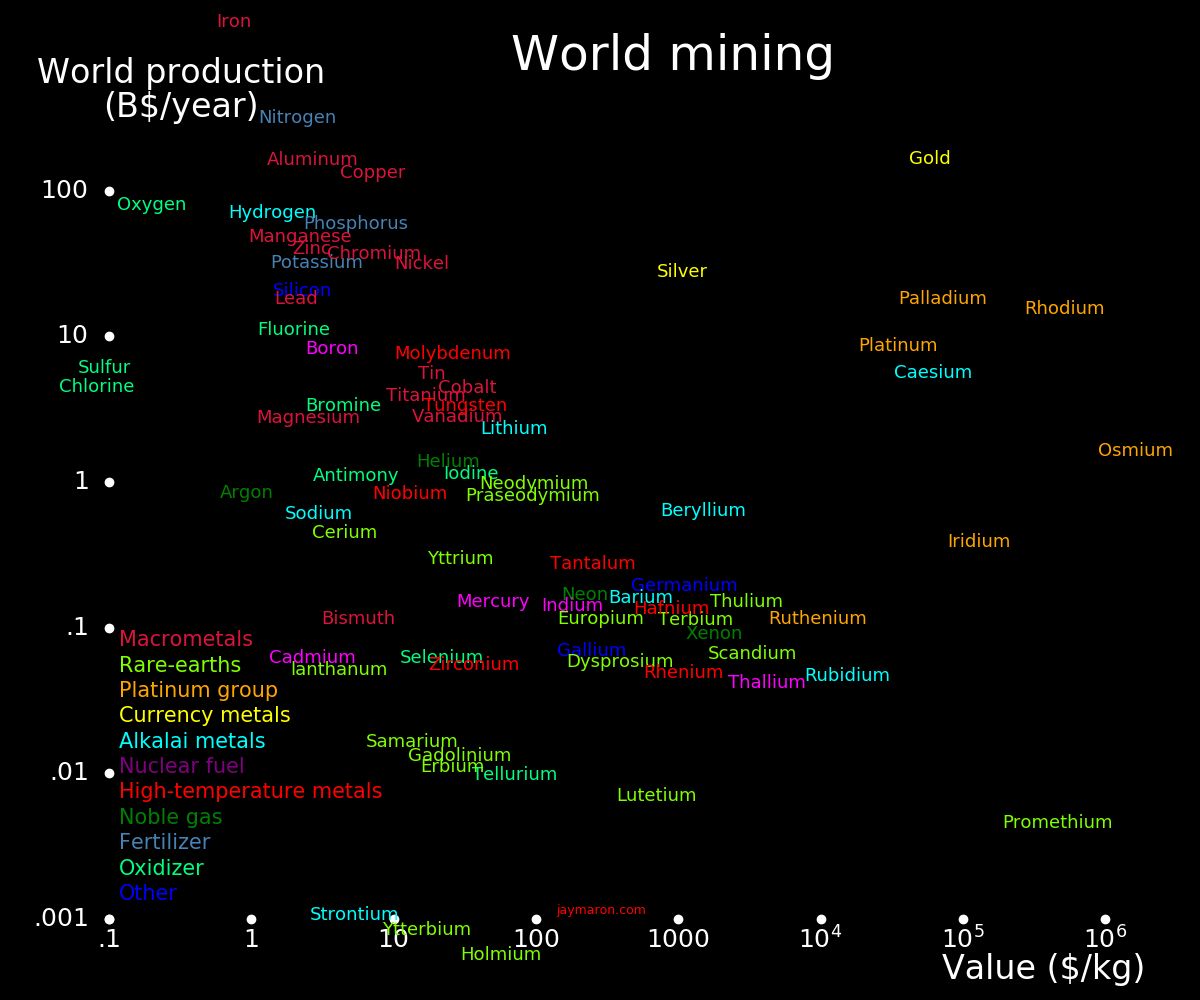
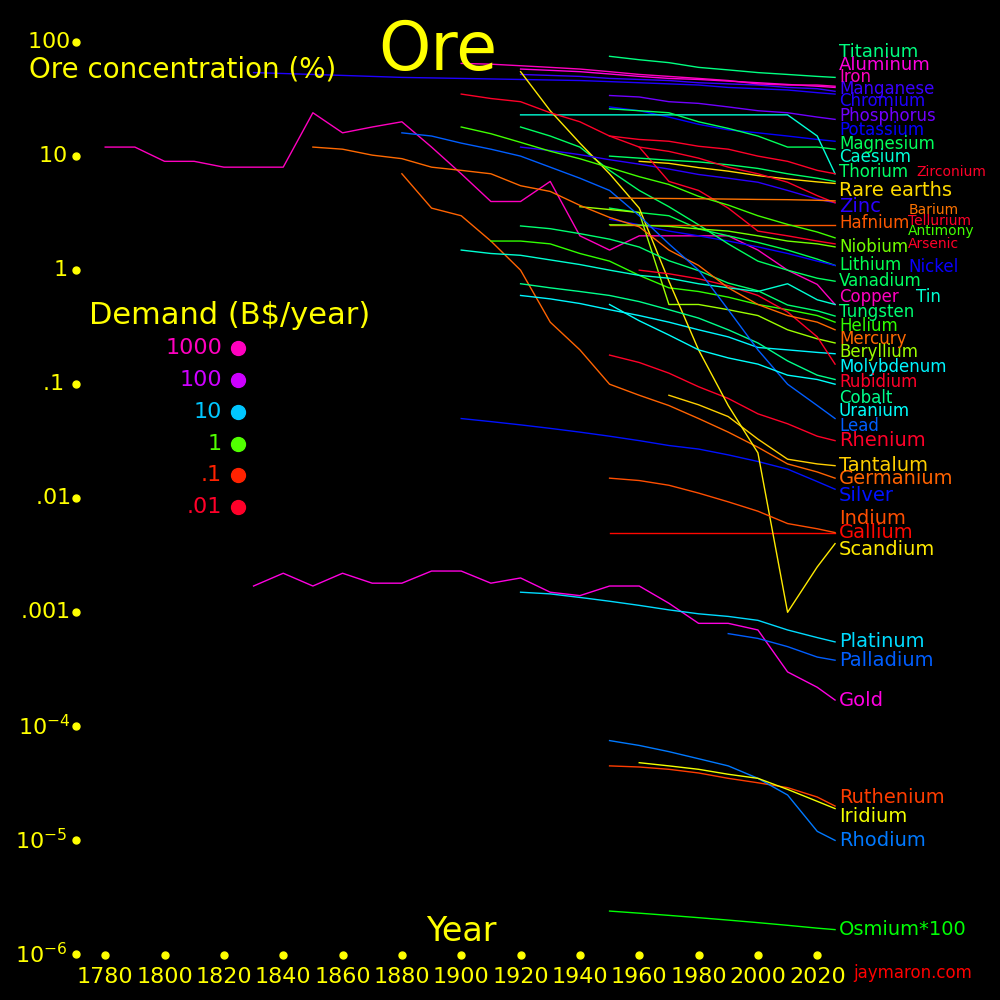
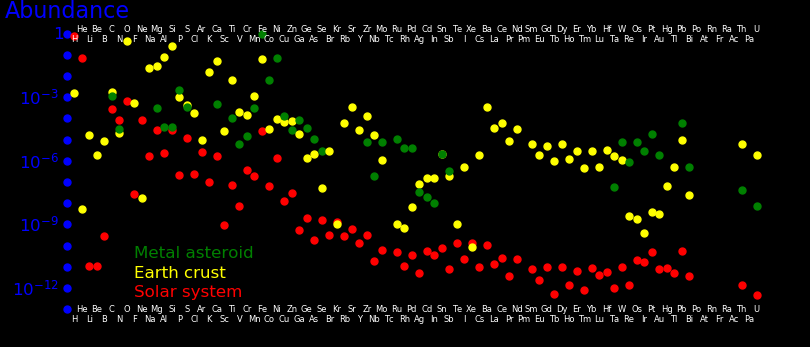
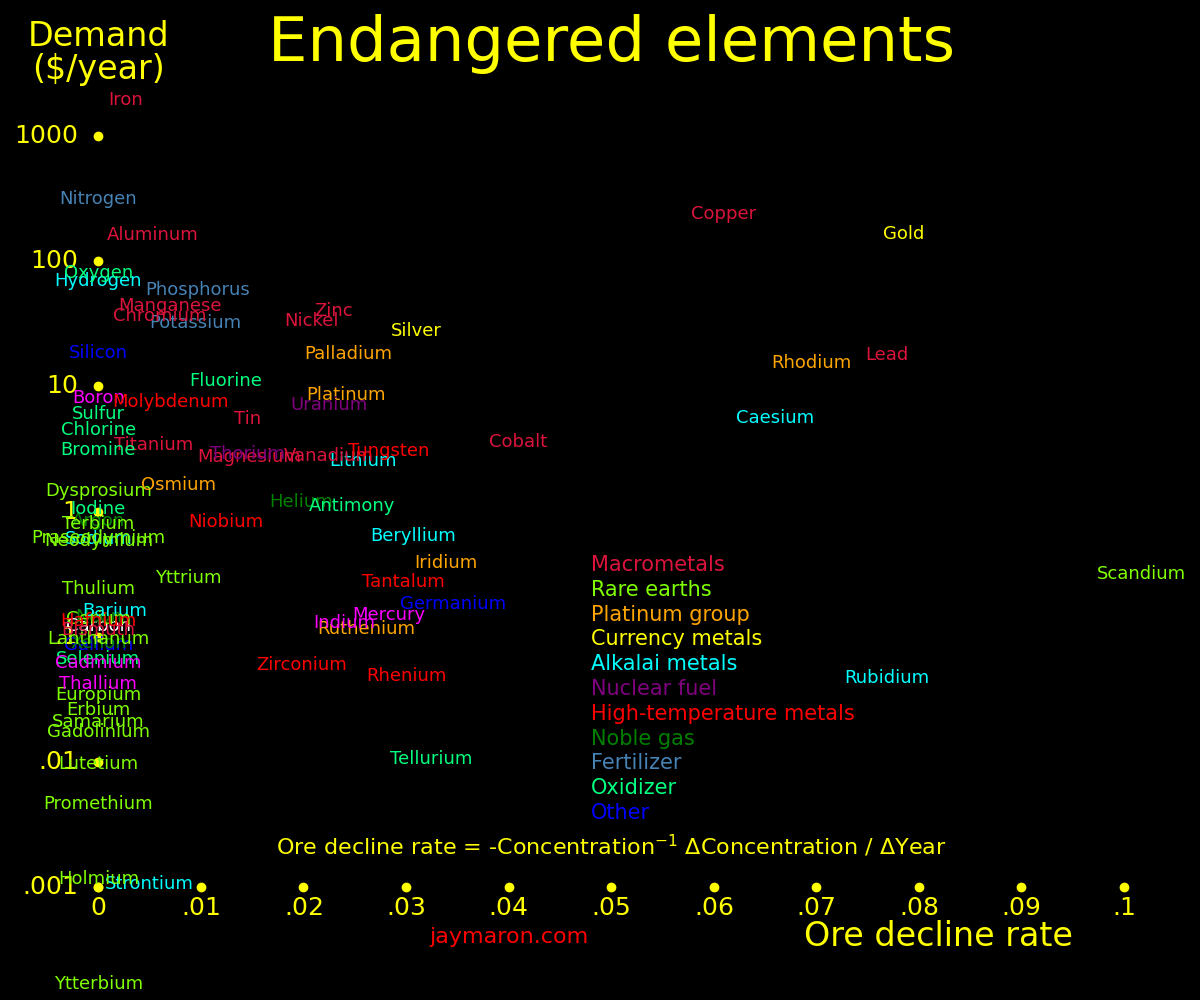
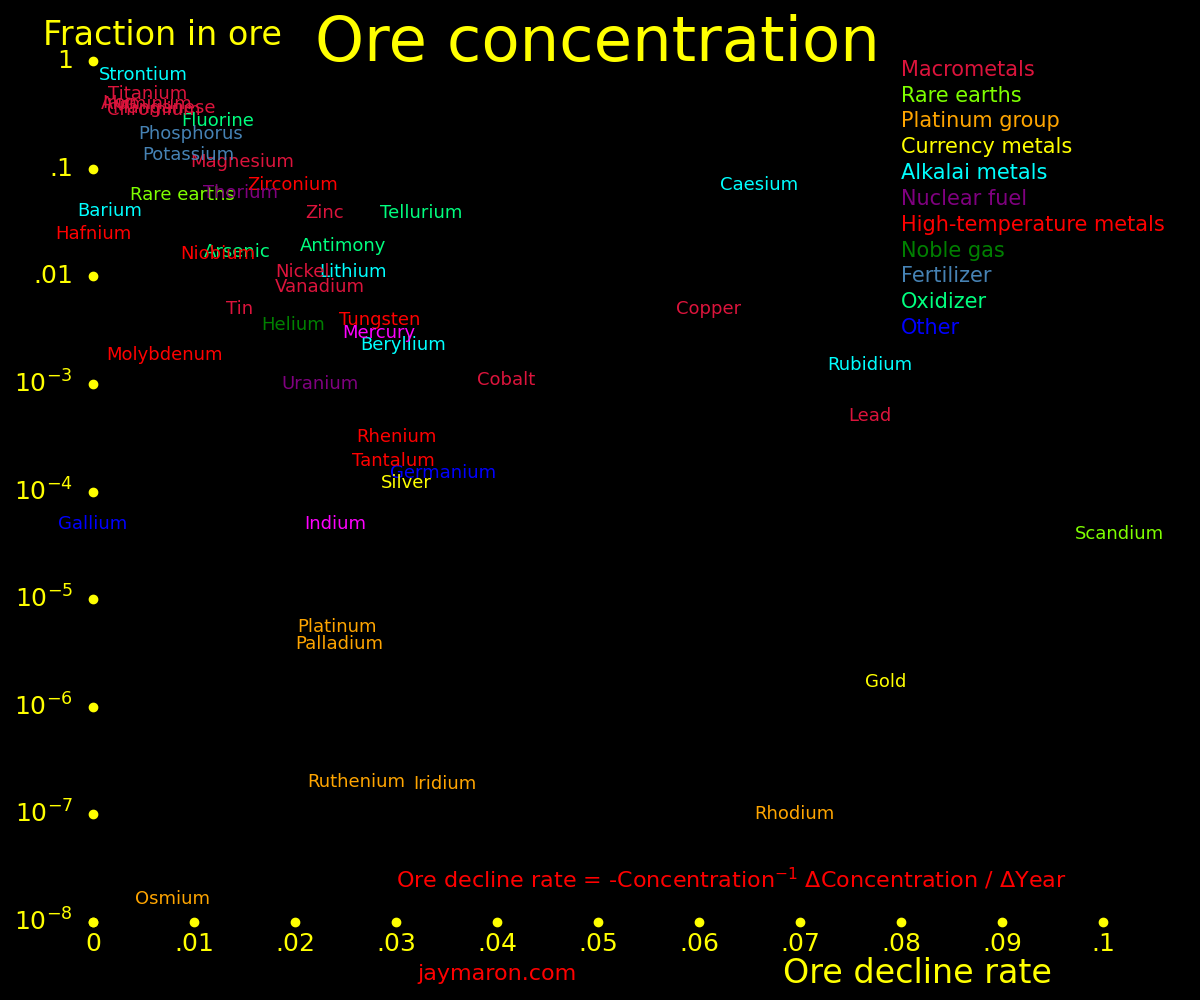
For most elements, price hinges on the energy required to extract it, which tends to be inversely proportional to the fraction of the element in ore.
"Demand" is the demand for the element in $/year.
Demand = Price * Supply = ($/kg) * (kg/year) = $/year
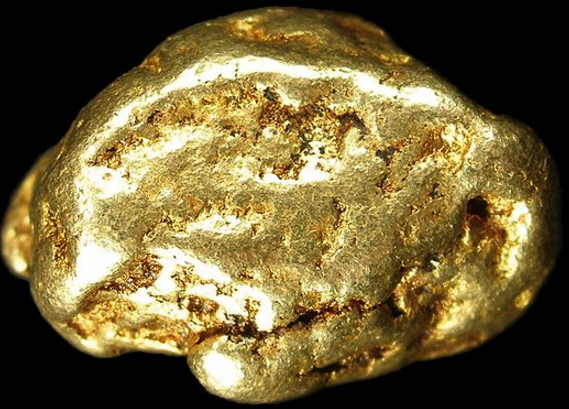
Demand is dominated by iron, aluminum, copper, and gold.
Historically, the copper concentration in copper ore decreases with time. It was 12% in 1770, 1% in 2000, and is .5% today.
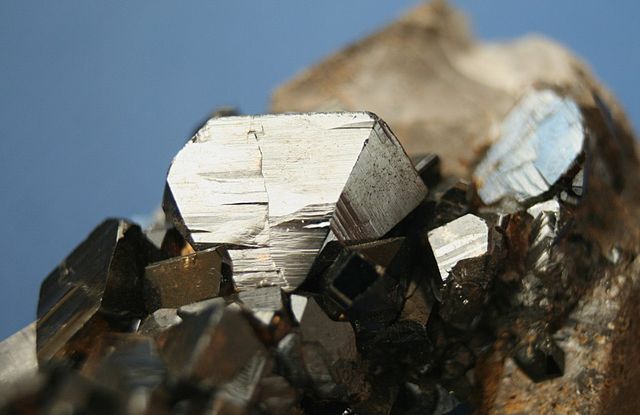
Endangered elements tend to have high demand and high ore decline rate. These are the elements in the chart toward the top and with large text size. If increased demand means resorting to weaker ore, the element might be endangered.
The elements with big demand and big decline are gold, silver, copper, cobalt, nickel, rhodium, and caesium.
The ore for nitrogen is air. If nitrogen demand rises, the quality of ore doesn't decline.
Define an ore decline rate:
Decline  =  - Quality-1 ΔQuality / ΔTime
Quality  =  Fraction of the element in the ore
Time     =  Time in years
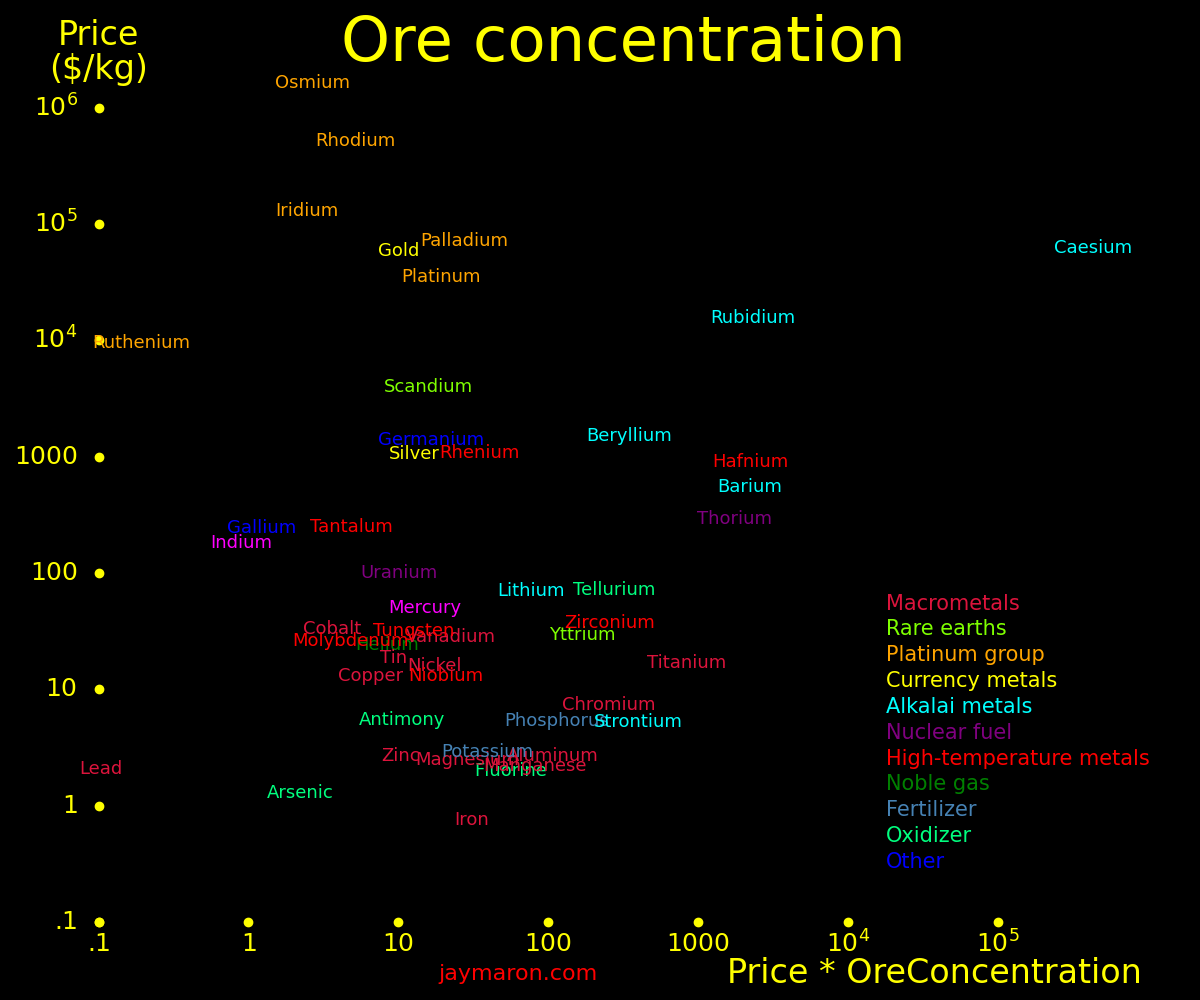
A good currency should be uncounterfeitable, immutable, have high value in $/kg, have high demand in $/year, and has industrial value. These elements tend to be toward the upper right of the chart.
An investment element can potentially have small supply. If supply is small, the price is unlikely to crash.
A currency is uncounterfeitable in terms of density if no element exists that is both more dense and more cheap. The elements with this property are iridium, platinum, rhenium, and tungsten.
.jpg) |
 |
 |
 |
 |
 |
|---|---|---|---|---|---|
 |
 |
 |
 |
 |
 |
-178918.jpg) |
 |
 |
|---|---|---|---|---|---|---|---|---|
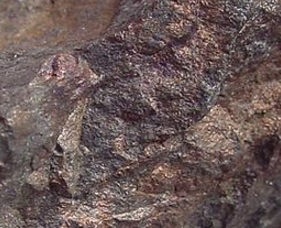
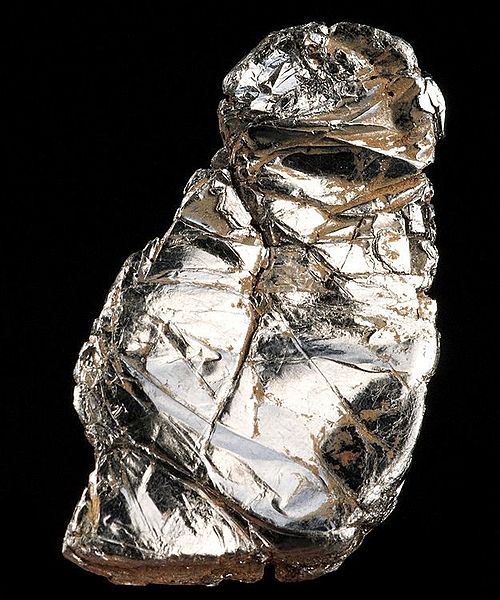
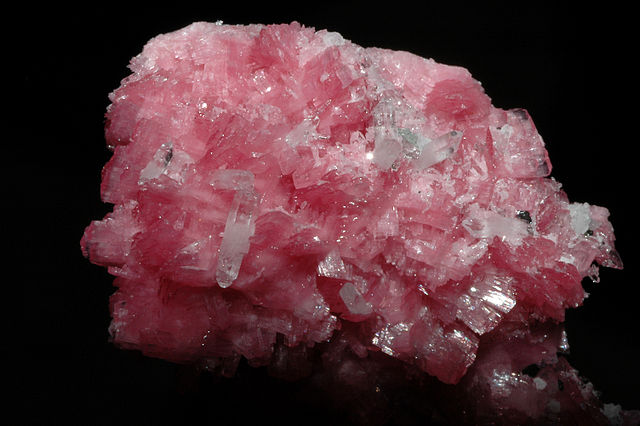
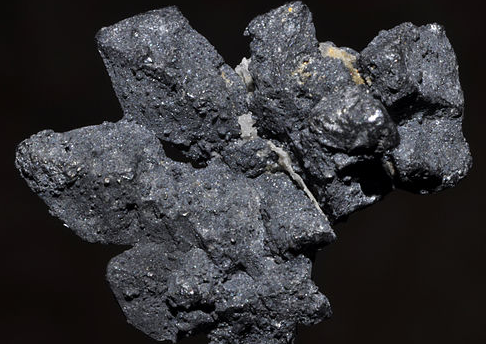
The most endangered elements are:
Element Uses Sources
Neodymium Neodymium magnet China
Terbium Neodymium magnet. Green phosphor China
Praseodymium Neodymium magnet China
Dysprosium Neodymium magnet China
Europium Red and blue phosphor China
Germanium Fiber optics, semiconductor China. Byproduct of zinc mining
Gallium Photocell
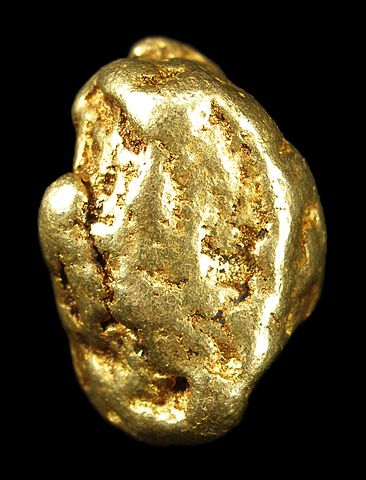
Gold Currency, jewelry, electronic Australia, Russia, USA, Canada, China
Silver Currency, jewelry, electronic
Copper Conductor, pipe Chile, DR Congo, Peru, USA, China
Cobalt Li-ion battery, steel alloy DR Congo
Nickel Li-ion battery, high-temp alloy China
Zinc Iron alloy, brass
Lithium Li-ion battery Australia, Chile
Platinum Catalyst South Africa
Palladium Catalyst South Africa, Russia
Rhodium Catalyst South Africa
Osmium Strong and hard metal South Africa, Russia, Canada
Iridium Strong and hard metal South Africa, Russia, Canada
Rhenium High-temperature alloy USA
Scandium Aluminum alloy China, Ukraine, Russia
Tantalum Capacitor. Hard carbide DR Congo, Rwanda
Caesium Drilling lubricant Canada
Phosphorus Fertilizer
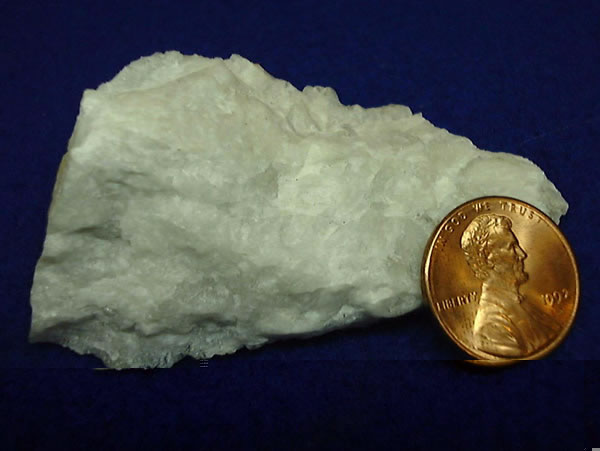
Quartz Semiconductor USA High-purity quartz
Building an Ecar for everyone in the world would overwhelm mining for neodymium, cobalt, and lithium.
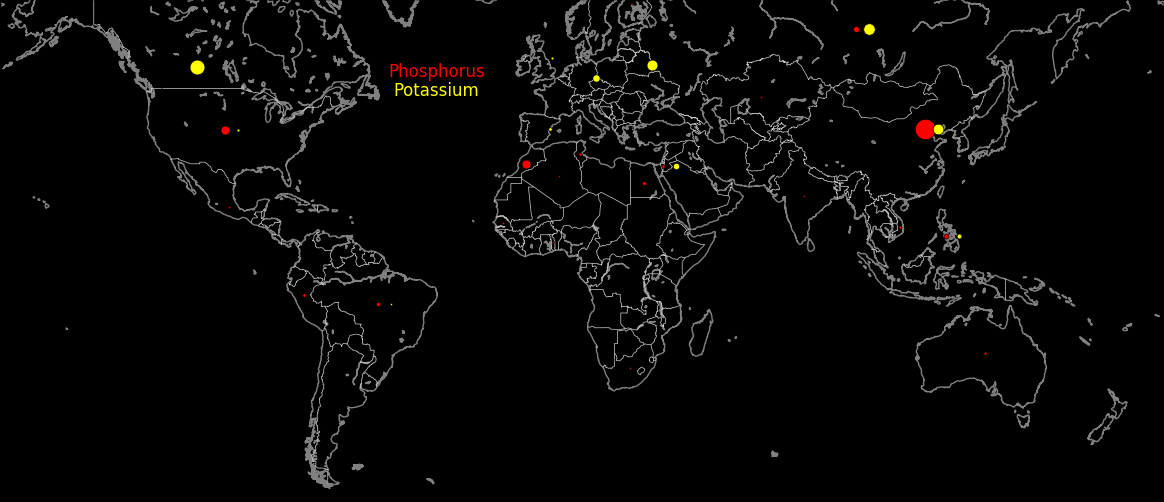
The limit for food and biomass is fertilizer, and this hinges on phosphorus, potassium, and nitrogen. Nitrogen is a product of energy. Phosphorus and potassium ore quality decreases rapidly with time. If the ore for potassium gets too weak, we can resort to seawater.
 |
|---|
 |
|---|
Mining appendix
Chart on endangered elements: Ore decline rate and demand
Chart on Price*OreConcentration and price
Chart on ore decline rate and ore concentration
 |
|---|
Iron is the cheapest metal by far. It's alloyed with more expansive metals to improve strength, corrosion resistance, etc.
          Price      % to     Uses
          $/kg    iron alloy

Iron             .2    90
Vanadium      600      92     Titanium alloy   4%
Manganese     140      93
Tungsten      115      12     High-temperature alloy        Carbide
Molybdenum     80      75     High-temperature alloy
Cobalt         56       8     High-temperature alloy        Battery
Niobium        40      90     Superconducting magnet
Titanium       35      12     Titanium alloy  95%           Aluminum alloy      Vanadium alloy     Carbide
Nickel         18      68     Nickel alloy
Chromium        9      95     Stainless steel
Silicon         6      60     Semiconductor
Zinc            3      60     Copper alloy    15% (brass)

Scandium     4000     Low     Aluminum alloy  65%           Fuel cell 20%
Beryllium    1000     Low     Copper alloy    80%           Beryllium alloy 20%
Zirconium     150     Low     High-temp alloy 90%           Ceramic             Nuclear reactor
Thorium        55     Low     Magnesium alloy 28%           Fission fuel 64%    Glass 8%
Tin            46     Low     Copper alloy     7% (bronze)  Solder
Copper         13     Low     Copper alloy    32%           Conductor           Pipe
Aluminum        3     Low     Aluminum alloy  92%           Titanium alloy
Magnesium       3     Low     Magnesium alloy 70%           Aluminum alloy      Zinc alloy         Manganese alloy
The prime catalysts are platinum, palladium, and rhodium. They're used for the chemical industry and for mufflers.
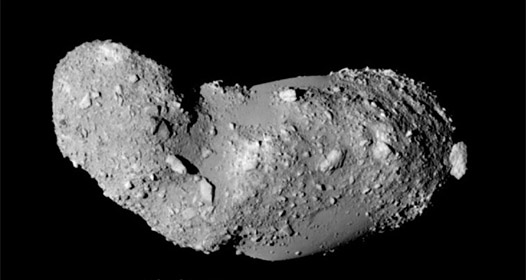
Metal asteroids have heavy metals. They also have lighter metals such as iron, nickel, cobalt, germanium, and gallium.
           Price    Uses                         Metal     Metal    Muffler  Muffler
           $/kg                                 asteroid  asteroid
                                                  ppm      $/kg      gram      $

Gold       170000   Currency, jewelry, electronic  1.8       .3
Silver       2900   Currency, jewelry, electronic   .1      0

Rhodium    390000   Catalyst, jewelry              4.1      1.6       1.5    580
Platinum    75000   Catalyst, jewelry             19        1.4       5      380
Palladium   59000   Catalyst                       3.8       .2       4      240
Ruthenium   40000   Catalyst, Electrical contact  11         .44


Rhenium     14000   High-temperature alloy           .85     .01
Osmium    2500000   Strong hard metal               7.6    19.0
Iridium    200000   Strong hard metal               3.0      .6
Tungsten      115   Strong hard metal. Carbide
Hafnium     13000   Carbide
Tantalum      360   Carbide. Capacitor

Iron             .8                            910000        .70
Nickel         18                               80000       1.4
Cobalt         56                                5000        .28
Copper         13                                3500        .05

Zirconium     150   Ceramic, high-temperature metal
Molybdenum     80   Iron alloy                      7       0
Niobium        40   Superconducting magnet

Uranium        90   Fission fuel .99
Thorium        55   Fission fuel .64                                                Magnesium alloy .28    Glass .08

Germanium   17000   Fiber optic, semiconductor     37        .6
Gallium      2200   Photocell,   semiconductor     80        .18

Bismuth        50
Tin            46   Bronze, solder
Mercury         5   Chemical, gold mining
Lead            2.5 Battery
 |
|---|
A neodymium magnet is Nd2Fe14B. Other rare-earths are often added to improve high-temperature performance, these being terbium, dysprosium, and praseodymium. Call these four rare earths the "Neodymium tribe". They have higher demand than other rare earths.
The phosphor tribe consists of terbium (green), europium (red and blue), yttrium (red), and lutetium (red). All but lutetium have high demand. Terbium is both a phosphor and a magnet element and has the highest demand.
The fiber-optic elements are germanium, erbium, thulium, and ytterbium.
Demand = Price * Supply = ($/kg) * (Production fraction)
           Price                          Production   Fraction to   Fraction to   Neo magnet   Demand
           $/kg                           fraction     Neo magnets   phosphors     mass frac    $/kg * Production fraction

Neodymium     220  Neo Magnet                  .15         .60        0             .27          33
Terbium      4000  Neo magnet, green phosphor  .012        .90         .075         .015         48
Dysprosium    940  Neo magnet                  .048        .38        0             .055         45
Praseodymium  230  Neo magnet                  .07         .60        0             .055         16.1

Lutetium      800  Red phosphor, phosphor host .00016     0            .5          0               .13
Europium      300  Red & blue phosphor         .011       0            .55         0              3.3
Yttrium        32  Red phosphor, alloy         .19        0            .6          0              6.1

Thulium      1500  Laser, fiber optics         .00078     0           0            0              1.2     Laser .40   Fiber optics .32
Erbium         30  Fiber-optic amplifier       .011       0           0            0               .33

Holmium        70  Low-temperatue magnet       .00023     0           0            0               .016   Low-temperature magnet .80
Samarium       14  High-temp samarium magnet   .015       0           0            0               .21

Thorium        55  Fission fuel                .11        0           0            0              9.9     Fission .64   Magnesium alloy .28   Glass .08
Ytterbium      40  Alloy, flare, fiber optic   .00013     0           0            0               .005   Fiber-optic amplifier
Gadolinium     40  Alloy                       .0062      0           0            0               .25
Cerium          6  Glass, abrasive             .31        0           0            0              1.6
Lanthanum       5  Sparker                     .18        0           0            0               .90
For "neo-magnet mass fraction", we average over all neodymium magnets. The mass fractions in individual magnets varies. If terbium were cheaper, magnets would have more of it.
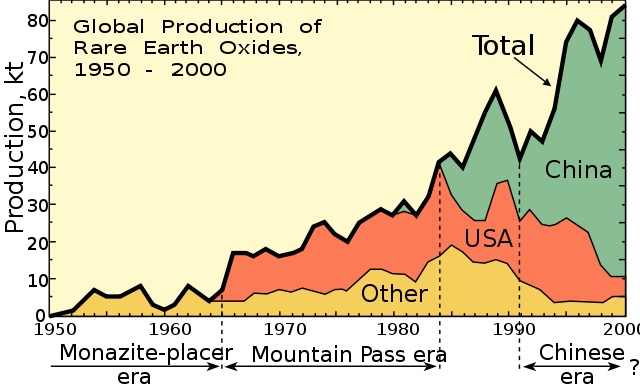
Rare-earths (2024):
    Production Mkg/yr    Reserves (Bkg)

World      400            130
China      270             44
USA         46              1.9
Myanmar     36            Low
Australia   13              5.7
Thailand    13            Low
Nigeria     13            Low
Brazil     Low             21
India      Low              6.9
Russia     Low              3.8
Vietnam    Low              3.5
Greenland  Low              1.5
Tanzania   Low               .9
S. Africa  Low               .9
Canada     Low               .8
Venezula   Low               .3
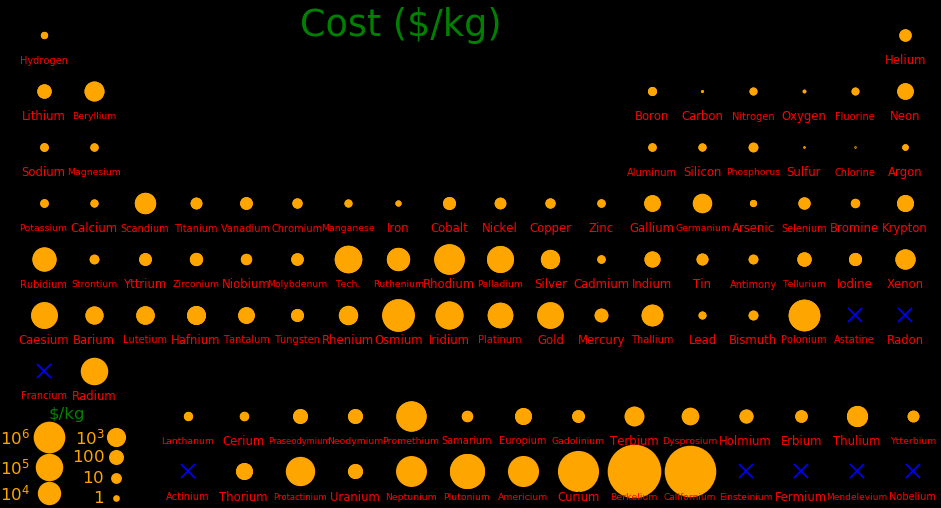
          Cost ($/kg)

Caesium     56000  Mining lubricant
Rubidium    10000  Atomic clock .40    Fiber optics & lens .28    Quantum computing .25  Medical isotope .22
Strontium    6000  Magnet              Drilling fluid .4   Fireworks .3  Ferrite ceramic magnet .3
Barium        300  Drilling fluid .75  Paint .29     Electronic .02  Glass .02
Lithium        22  Battery .87
          Price ($/kg)

Indium       1000  Solder
Thallium      300  Infrared glass
Bromine       300
Tellurium     120  Photocell .7        Alloy .15   Rubber .05  Thermocell
Iodine         50
Selenium       30
Antimony       15
Arsenic         3  Semiconductor

Xenon       10000  Anaesthetic
Krypton      4000
Neon          120
Helium         96  Cryo .23  Lift .15  Electronics .14  Optics .11 Weld .09
Argon          10
 |
 |
 |
 |
 |
|---|---|---|---|---|
The critical metals are copper, lithium, cobalt, copper, neodymium, silver, nickel, and rare Earths. Cobalt is the dominant cost for lithium-ion batteries, and copper is the dominant cost for solar cells, wind turbines, and electric motors.
Lithium-ion batteries can be made with or without cobalt, but cobalt batteries have the biggest energy/mass.
Making a billion electric cars would overwhelm mining for neodymium, terbium, dysproseum, praseodymium, and cobalt.
For a neodymium magnet, half the cost is neodymium and half the cost is other rare earths.
For the cost of an electric car, we assume a battery energy of 100 MJoule, a motor power of 100 kWatt, a mass of 1 ton, and a 1 kW photocell system. A photocell system has silver in the photocell and copper in the grid. Cobalt is a dominant factor in car cost.
Gallium improves the efficiency of photocells. Most photocells don't have gallium because of the cost. Gallium also enables thin-film photocells.
     Element price  Ecar cost | Billion Ecars  Mining  Reserves |  Battery   Battery  |  Photocell  Photocell | Wind   Wind |  Motor     Motor  | Car body  Car body
         $/kg         $/car   |     Bkg        Bkg/yr    Bkg    | kg/MJoule  $/MJoule |  kg/kWatt    $/kWatt  | kg/kW  $/kW | kg/kWatt  $/kWatt |  kg/ton    $/ton
                              |                                 |                     |                       |             |                   |
Cobalt        56     1120     |    20           .12       7     |    .20     11       |                       |             |                   |
Copper        13      110     |     8.6       18        700     |                     |    5          65      |   4     56  |    .036     .47   |
Lithium       22       50     |     2.3         .6       30     |    .023      .511   |                       |             |                   |
Silver      2900      100     |      .034       .026       .53  |                     |     .034     100      |             |                   |
Nickel        18      360     |    20          2.2       80     |    .20      3.6     |                       |             |                   |
Silicon        6       24     |     4          1.5     Vast     |                     |    4.0        24      |             |                   |
Gallium     2200       22     |      .01        .00035     .6   |                     |     .01       22      |             |                   |
Aluminum       6      600     |   110         60       Vast     |                     |   21          63      |             |                   |     90    540
Steel          1.2    720     |   600       2600       Vast     |                     |                       |  70     84  |                   |    600    720
Concrete        .12           |            30000       Vast     |                     |                       | 250     30  |                   |
Carbon fiber  20              |                 .2     Vast     |                     |                       |  15    300  |                   |
                              |                                 |                     |                       |             |                   |
Neodymium    220      140     |      .6         .06      20     |                     |                       |   .14   31  |    .0062   1.4    |
Terbium     4000       20     |      .005       .0048     1.6   |                     |                       |   .005  20  |    .00005   .20   |
Dysprosium   940       28     |      .03        .019      6     |                     |                       |   .012  11  |    .0003    .28   |
Praseodymium 230       18     |      .08        .028      9     |                     |                       |   .03    7  |    .0008    .18   |
Battery type   Energy/mass (MJoule/kg)

LiNiCoAlO2   .79
LiNMnCo      .74
LiCoO2       .70
LiMnO2       .7
LiFePO4      .55
LiMn2O4      .54
Li4Ti5O12    .4
Nickel       .36   Nickel metal hydride
Lead         .18
 |
|---|
         Mining   Fertilizer  Reserves  Carbon  Carbon    Price  Usual form
        Bkg/year   Bkg/year     Bkg     kg/kg   Bkg/year  $/kg

Phosphorus   22      11.0         260    1.30    14.3     56      Monoammonium phosphate  NH4H2PO4
Potassium    34      11.0        3240    2.64    29.0     11.8    Potassium chloride      KCl
Nitrogen     38      30.0    Infinite    1.09    32.7      5.66   Urea                    CO(NH2)2
"Carbon kg/kg" is the carbon emitted to produce 1 kg of element.
"Carbon Bkg/year" is the carbon emitted by the world due to the fertilizer element.
|
|---|
Helium is special for cryogenics because it's the only element that's a liquid at 0 Kelvin. Superconducting magnets use liquid helium at 4 Kelvin. Most helium comes from methane mines in Kansas, which are enriched in helium.
Helium can also make a dilution refrigerator and reach 2 millikelvin, which is critical for solid state physics and quantum computing. They rely on the isotope helium-3, which is 2 ppm of natural helium. Helium-3 can be obtained by enriching natural helium or with a fission reactor.
Lithium-6 + Neutron  →  Helium-4 + Tritium

Tritium  →  Helium-3 + Electron               Beta decay wit a half life of 12.3 years.
Tritium is 1 M$/kg and helium-3 is 20 M$/kg.
Tritium is a radioactive power source with a very low x-ray energy and hence requires minimal shielding.
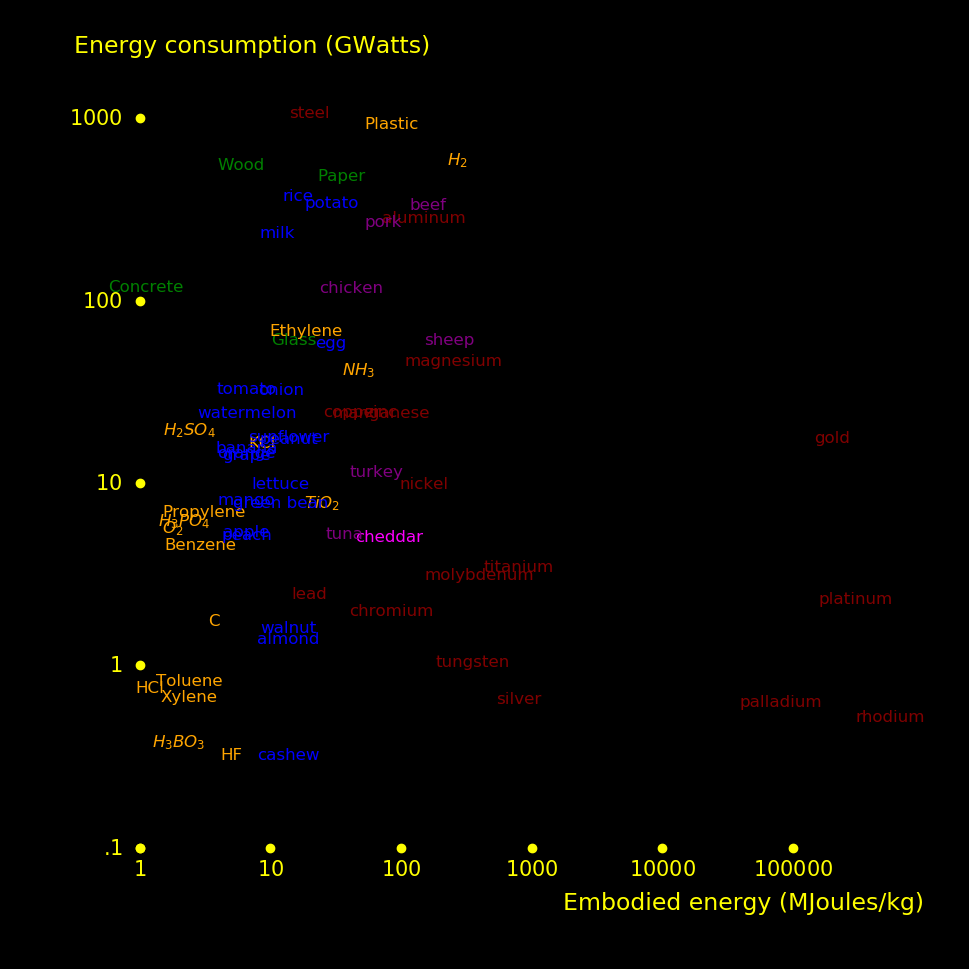
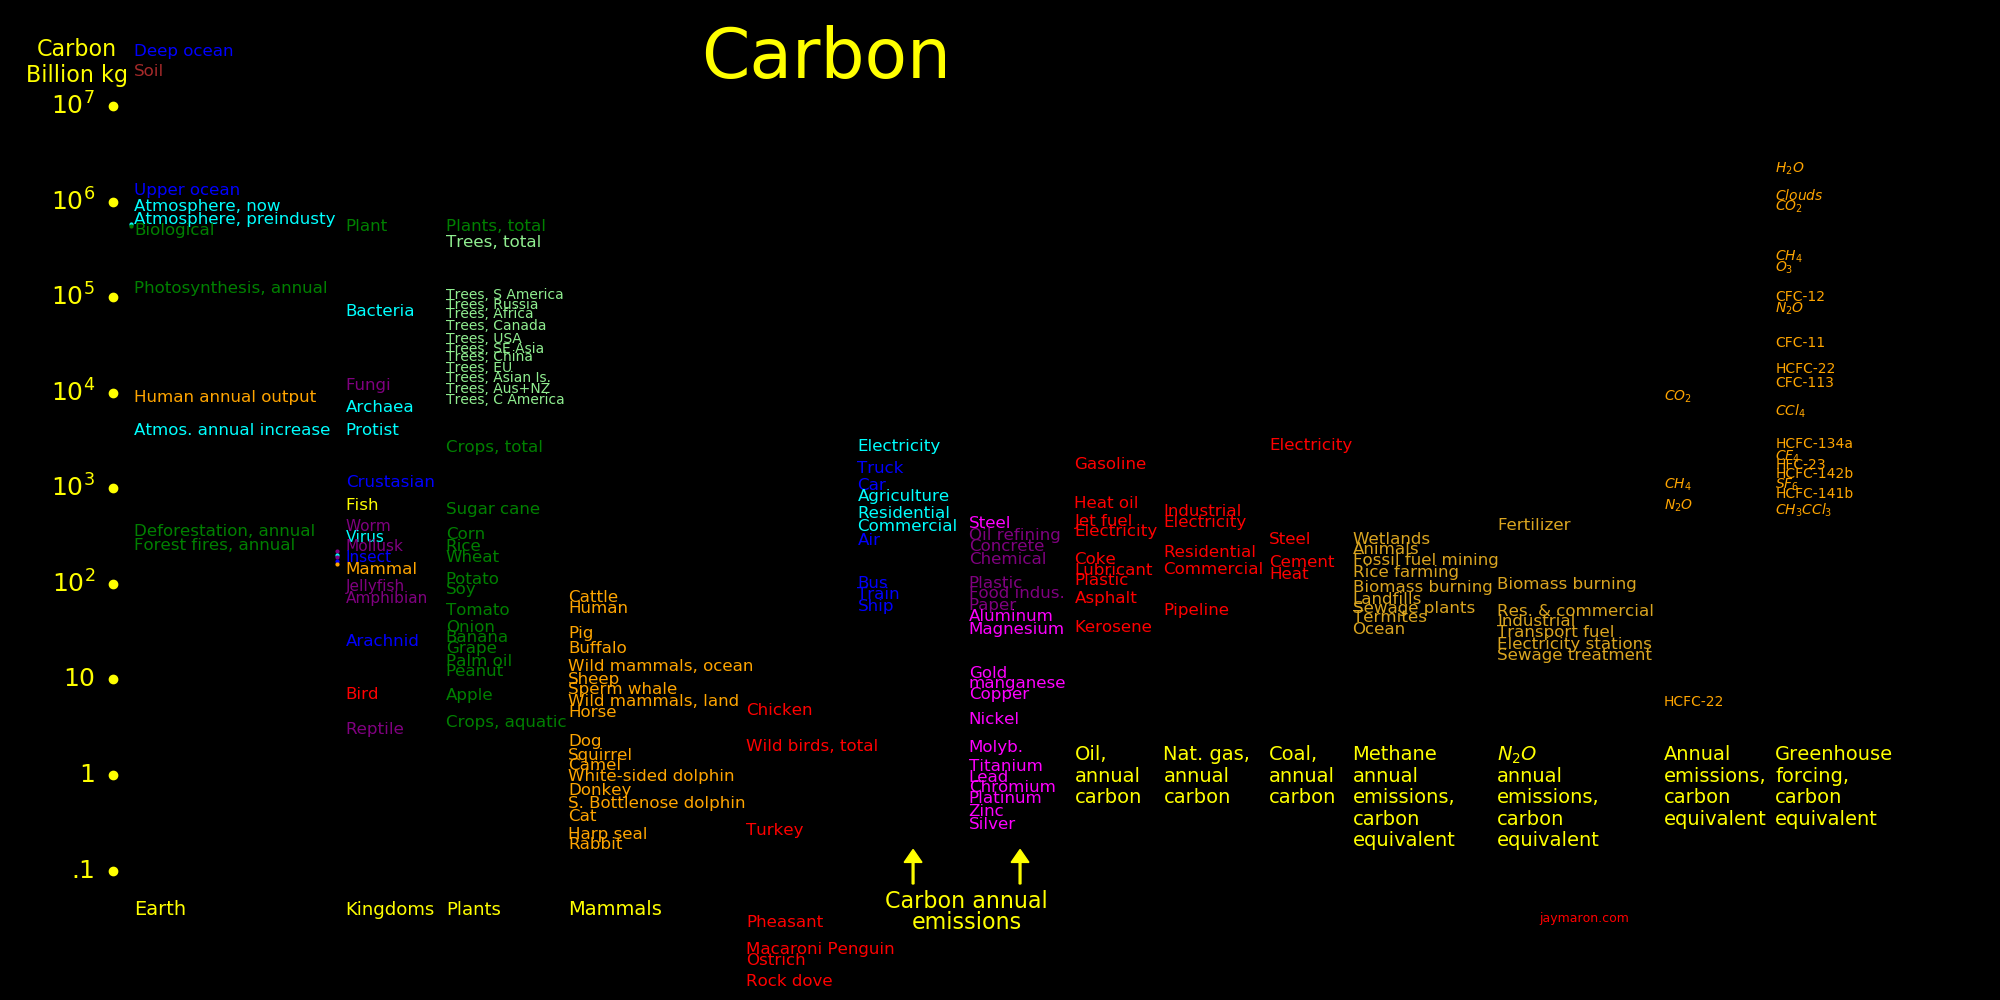
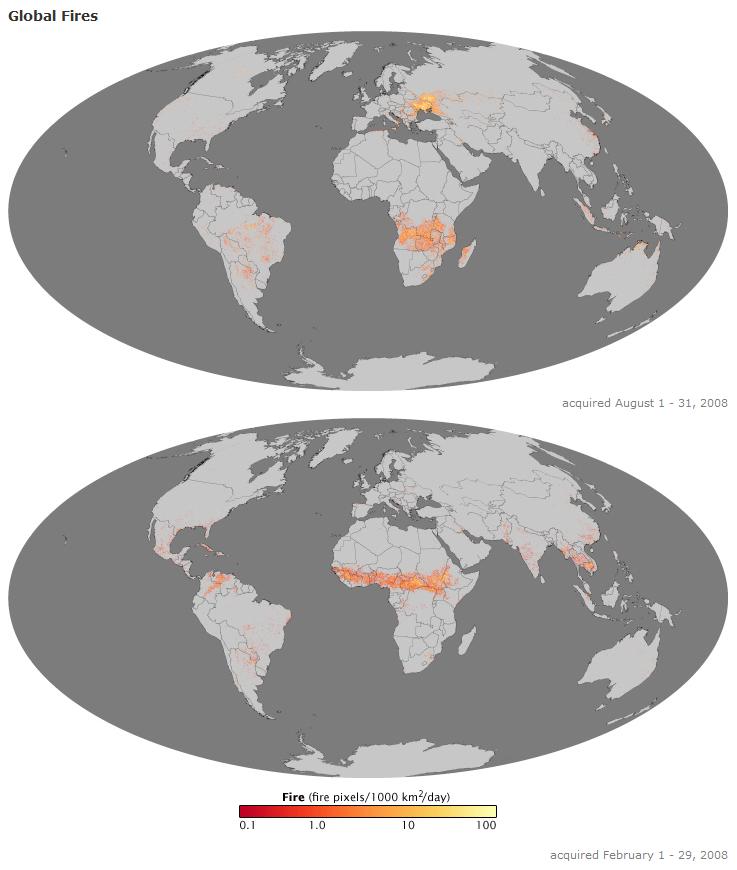
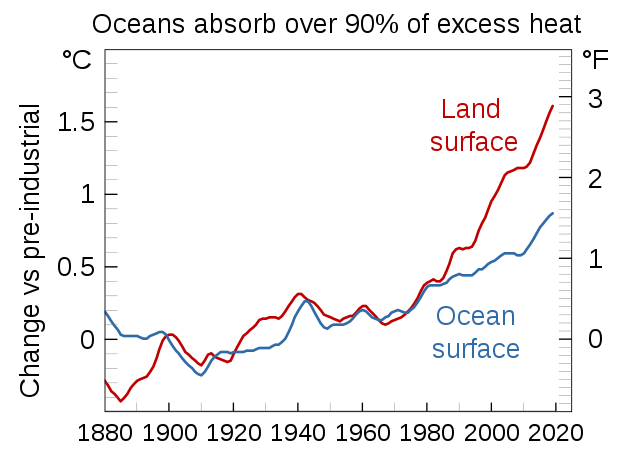
The plot shows how much energy the world uses per year for primary materials. The materials that consume the most energy are are steel, plastic, hydrogen, wood, and food.
Hydrogen is a primary chemical. 45% of hydrogen becomes ammonia and 80% of ammonia becomes fertilizer.
 |
|---|
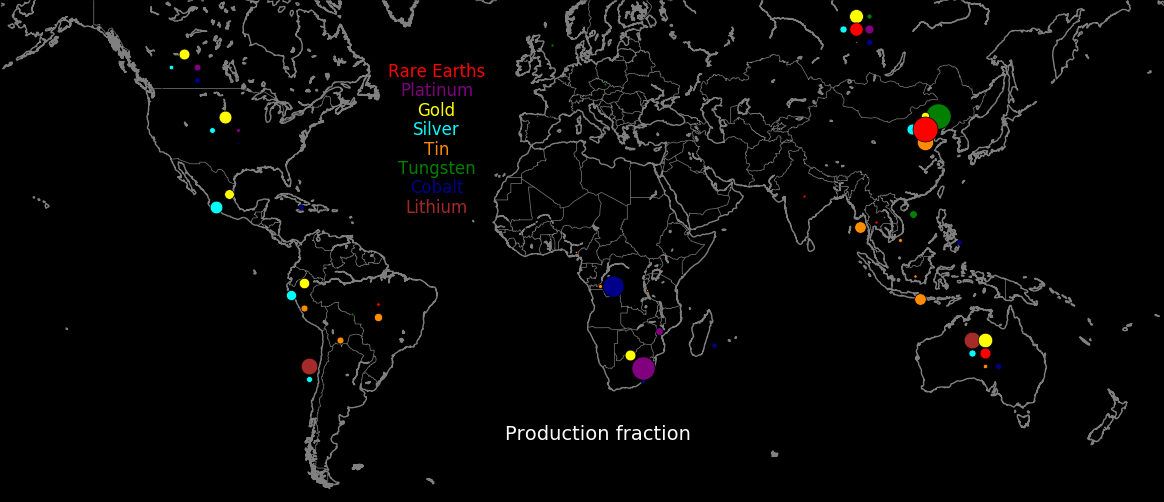
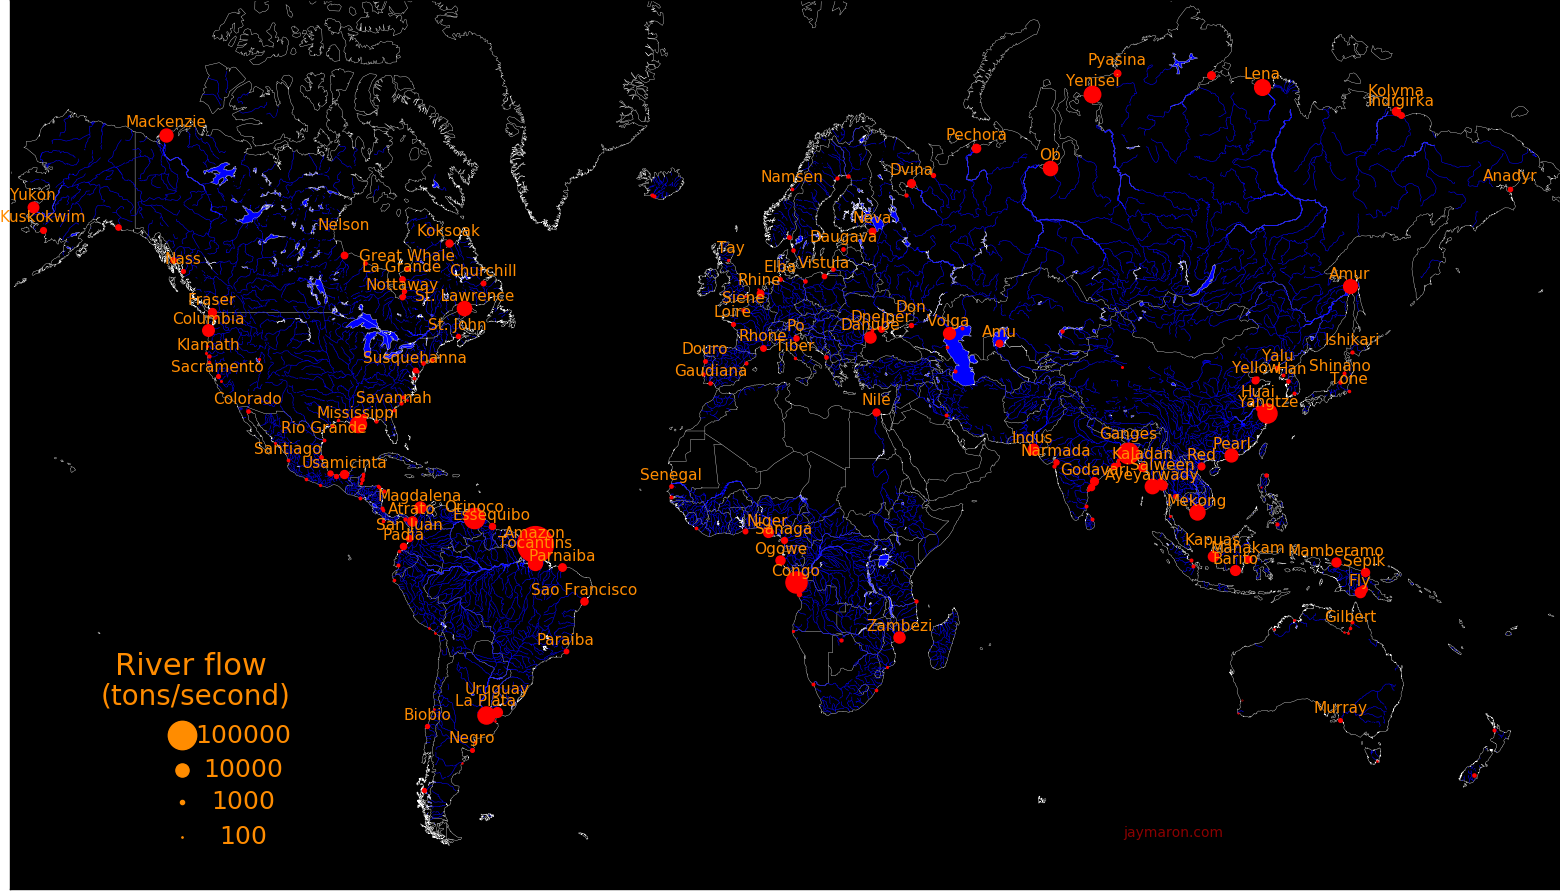
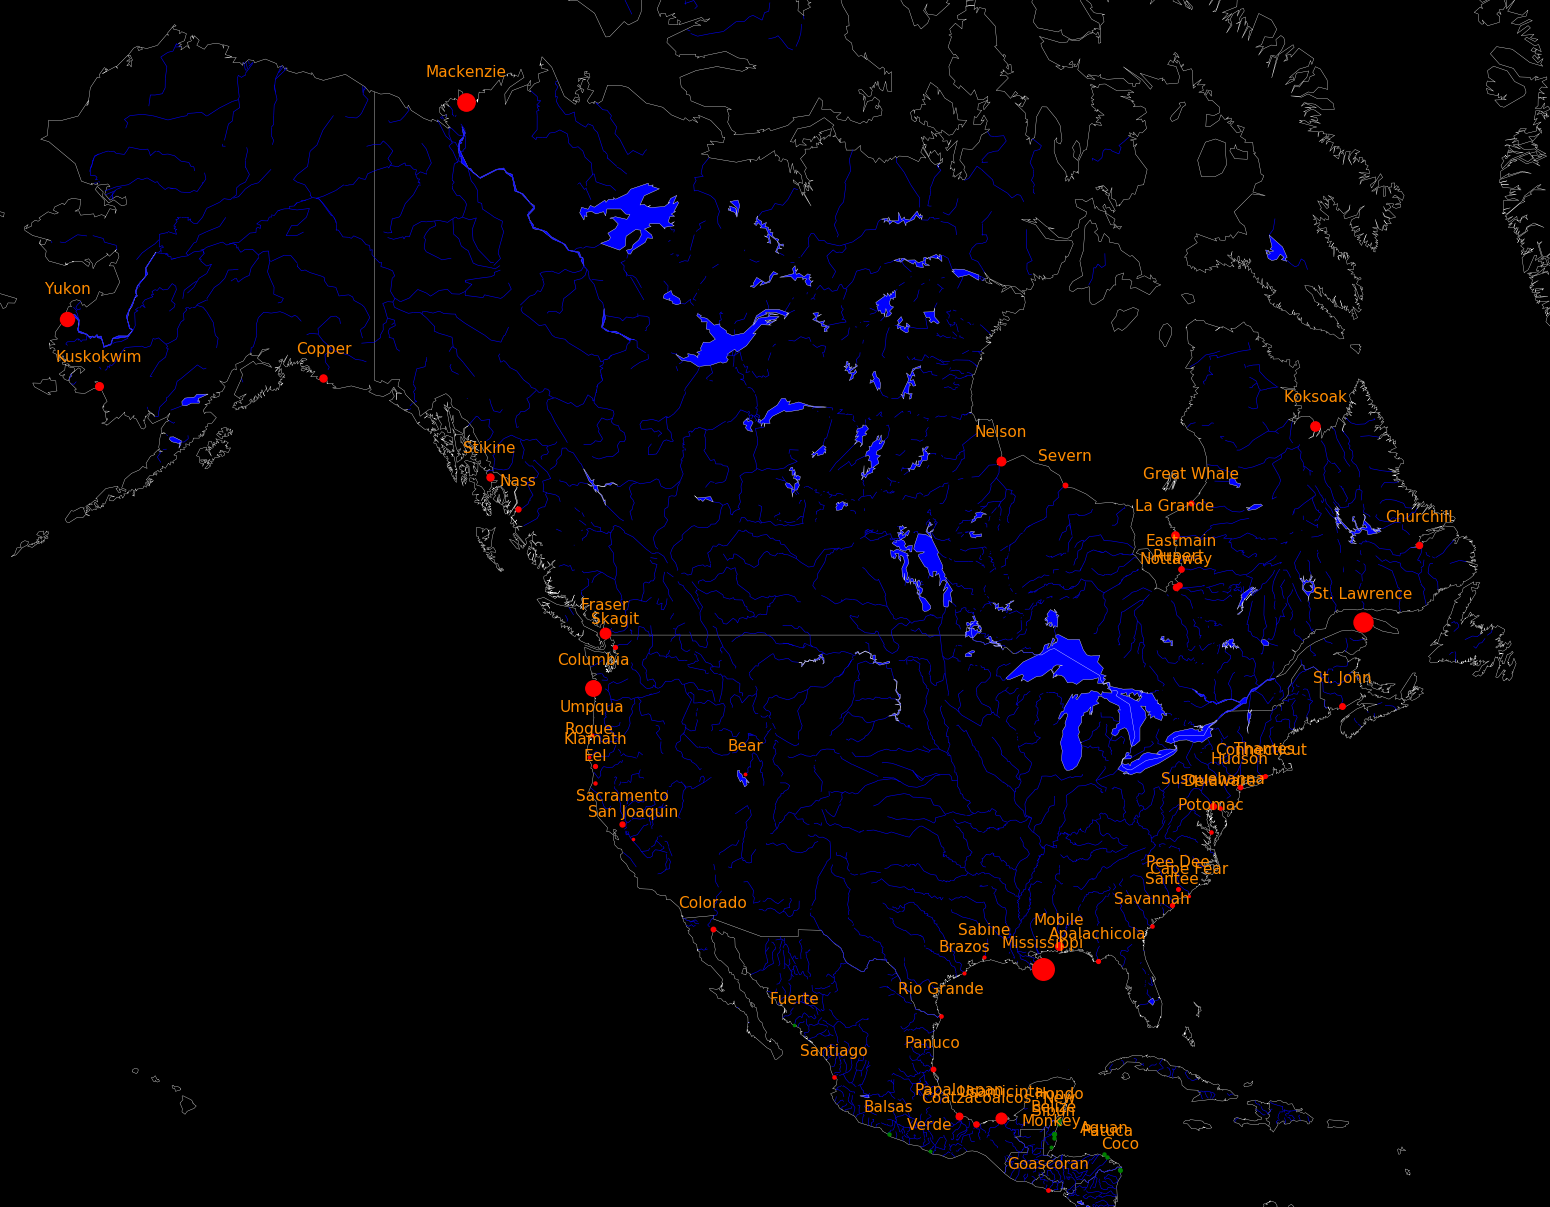
Dot area scales with power production.
 |
|---|
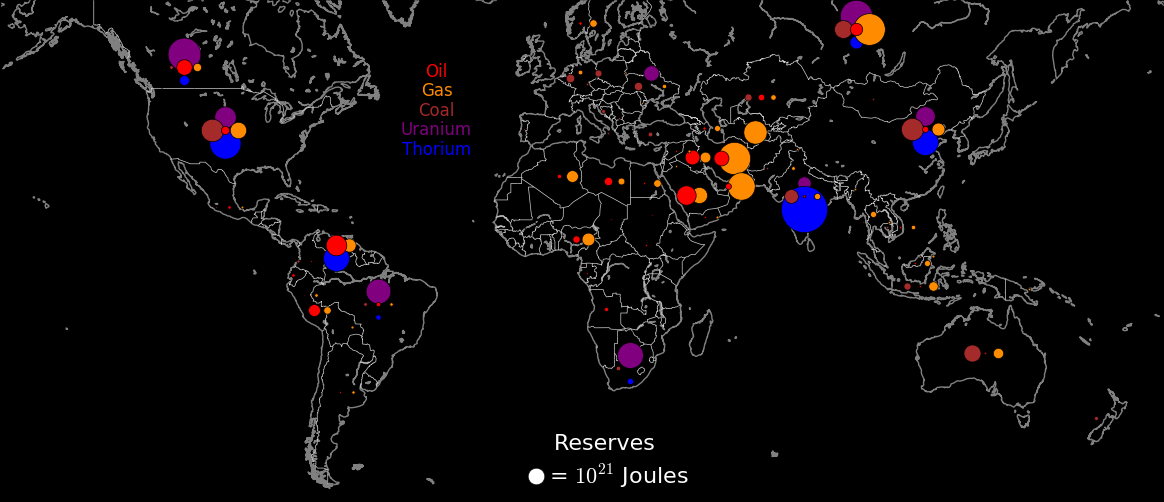
Nuclear reserves are infinite, especially if you harness thorium.
 |
|---|
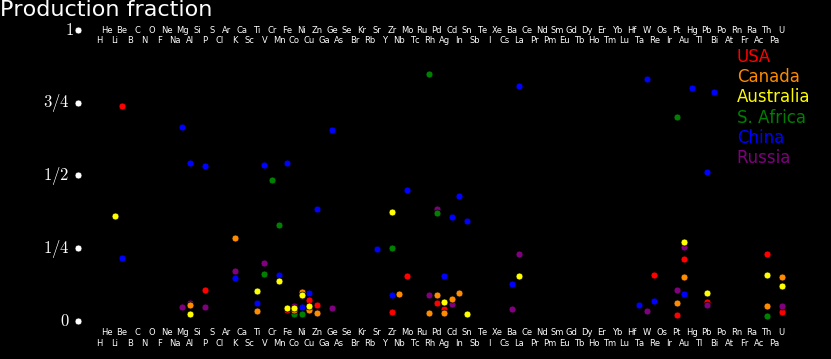
Mining prowess hinges on energy. America dominates mining for only one element: beryllium.
 |
|---|
 |
|---|
         Energy/Carbon  Energy/mass
           MJoule/kg    MJoules/kg

Natural gas   73           55
Oil           53           46
Coal          38           32
 |
|---|
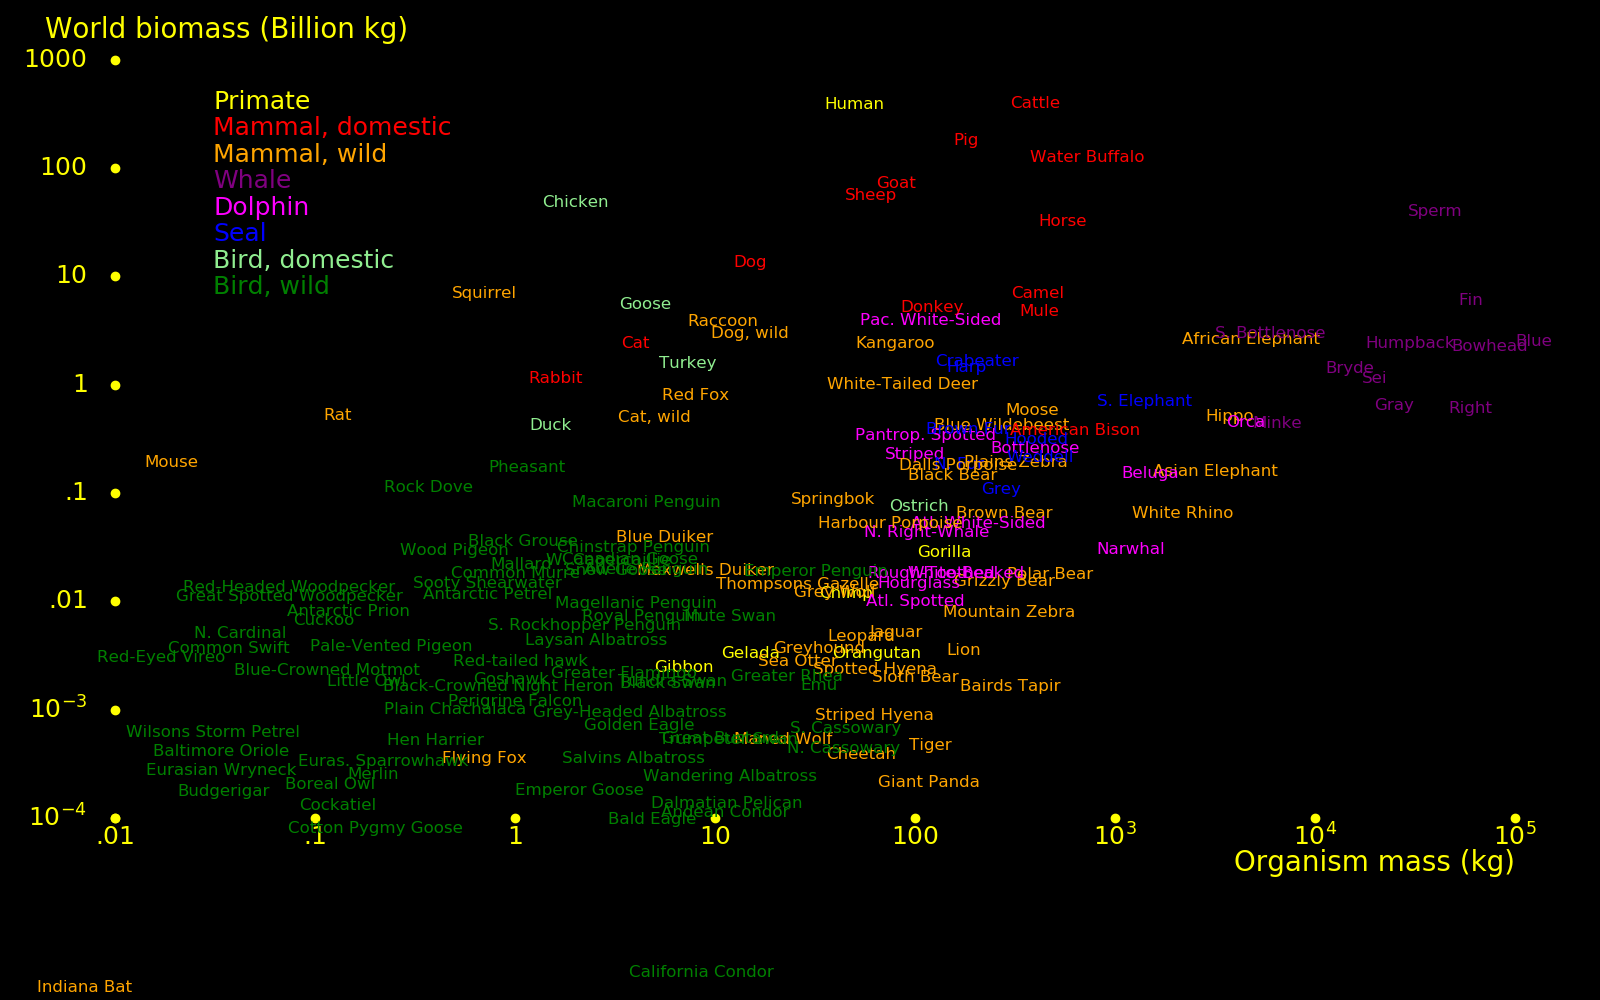
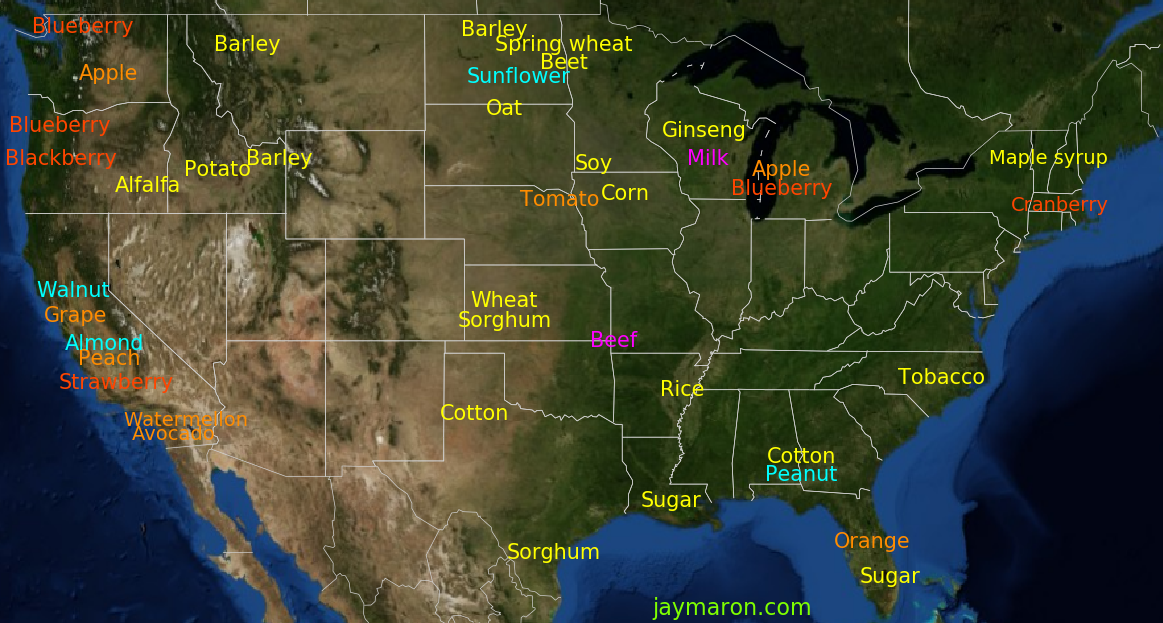
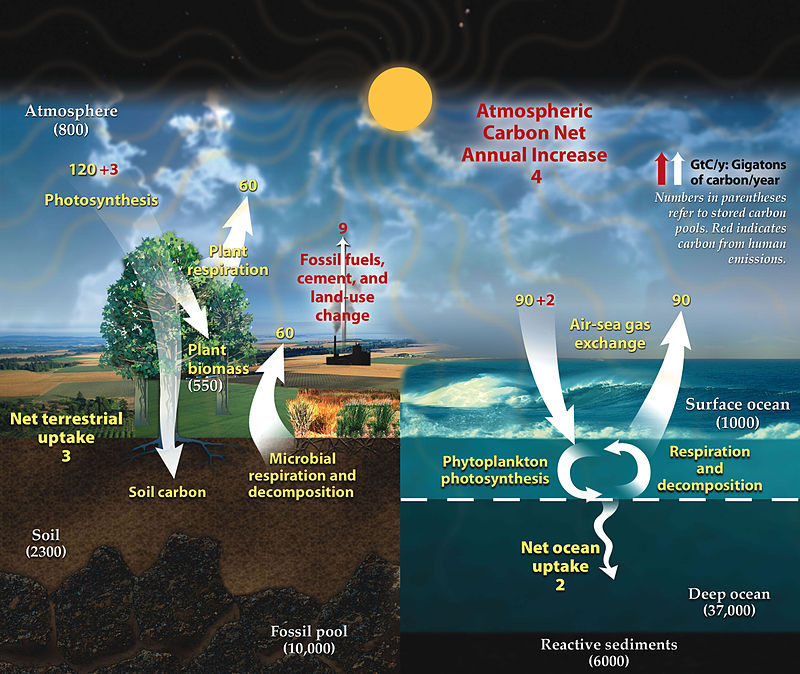
Plant biomass is dominate by trees. Farm biomass is dominated by cane, corn, rice, and wheat.
There is far more biomass on land than in the oceans. This is because oceans are nutrient-poor.
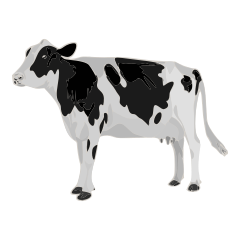
Domestic mammals outweigh wild mammals, and domestic birds outweigh wild birds. Cows dominate domestic mammal biomass. Cows and humans have the same biomass.
Wild mammal biomass is dominated by whales.
 |
|---|
Land carrying capacity hinges on fertilizer, water, sun, technology, and mechanization.
 |
|---|
 |
 |
|---|---|
Livestock can harness land that is unfit for crops. Crops require prime land or you can't compete. Livestock are also easier to farm than crops.
As evidence for the importance of cows, cows have more biomass than all other farm animals combined. The distribution of world land is:
                      World
                     fraction

Crops, seasonal        .109      Sugar cane, wheat, corn, rice, etc.
Crops, permanent       .012      Trees that bear fruits and nuts
Pastures for grazing   .263
Wheat produces .22 Watts/meter2 of food power, and grass-fed cows produce .019 Watts/meter2. Wheat produces 12 times as much food power as cows.
 |
|---|
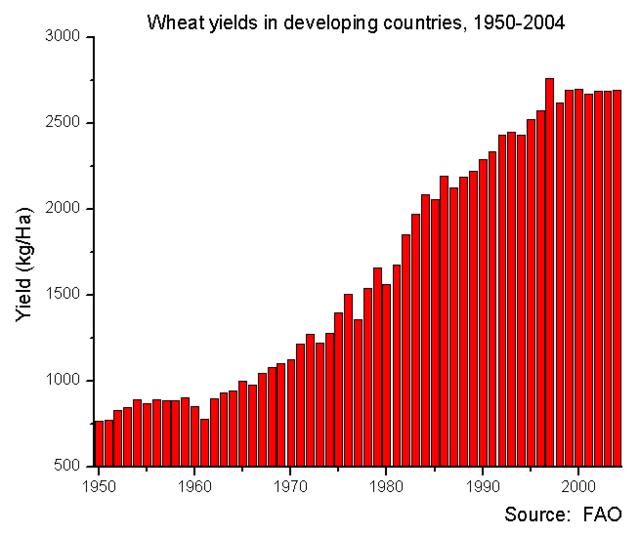
American wheat yield is typically .5 kg/meter2, which can support 1800 people/km2.
Wheat production per area        =    .5  kg/meter2
Wheat Calories/kg                =  3400  Calories/kg
1 Calorie                        =  4184  Joule/kg
Wheat energy/kg                  =  14.2  MJoule/kg
Wheat food energy production     =   .22  Watt/meter2
Human power consumption          =   120  Watt
Area required for 1 human        =   545  meter2
Land carrying capacity           =  1800  People/km2
 |
 |
|---|---|
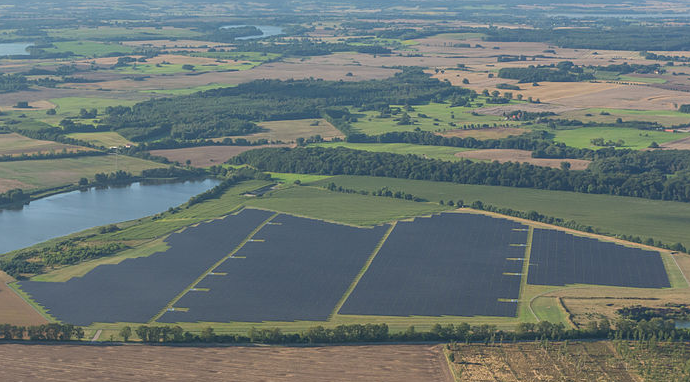
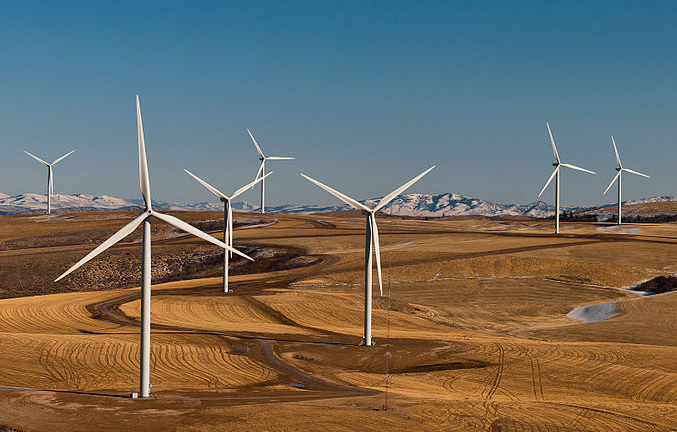
                Power/Area   Install   Cost   Type of energy
                Watt/meter2  Watt/$   MJoule/$

Natural gas plant   4000      1.2      60     Electric
Coal plant          4000       .4      30     Electric
Nuclear plant       4000       .2      22     Electric
Hydro                100       .4      60     Electric
Solar photovoltaic    30       .5      80     Electric
Icemaking in winter   20                      Embodied energy of ice. Use a pond to make ice.
Wind, onshore         10       .7      90     Electric
Wind, offshore        12       .15     45     Electric
Algae                  2                      Biomass → heat
Trees                  1                      Biomass → heat
Grass in Brazil        1                      Biomass → heat
Grass in Midwest        .5                    Biomass → heat
Sugar cane in Brazil    .5                    Food calories
Wheat in Midwest        .2                    Food calories
Cows in Midwest         .02                   Food calories
Heat can be converted to electric energy with 40 percent efficiency.
Farming cost inputs:
               Iowa    Iowa    Iowa   Brazil
               cows    corn    soy     soy
              $/acre  $/acre  $/acre  $/acre

Land            56     256    256      60
Labor           22.9    42.7   33.6    20
Seed             0     114.4   49.2    25
Machinery        5.2    70.2   64.5    40
Other            5.2    31.9   26.9    16

Nitrogen        27.2    71.7    0       0
Phosphorus      11.7    29.6   19.5    25
Potassium       12.0    18.3   27.9    35
Lime             0      15.7   15.7    15

Herbicide        4.6    39.6   48.7    40
Insecticide      0      18.4    0      10
Fungicide        0       0      0      25
Other pesticide  0       0      0       4

Total          137.9   770.8  542.0   315
The yield in Iowa is 202 bushels of corn per acre and 62 bushels of soy per acre.
Data from Iowa State University
USA and Brazil are soy superpowers. Data from 2016.
          Produce  Export   Import
          Bkg/yr   Bkg/yr   Bkg/yr

World       330
USA         117     58       0
Brazil       96     76       0
Argentina    59      2.1     5
India        14.0    0       0
China        12.1    0      86
Paraguay      9.2    6.0     0
Canada        5.8    4.9     0
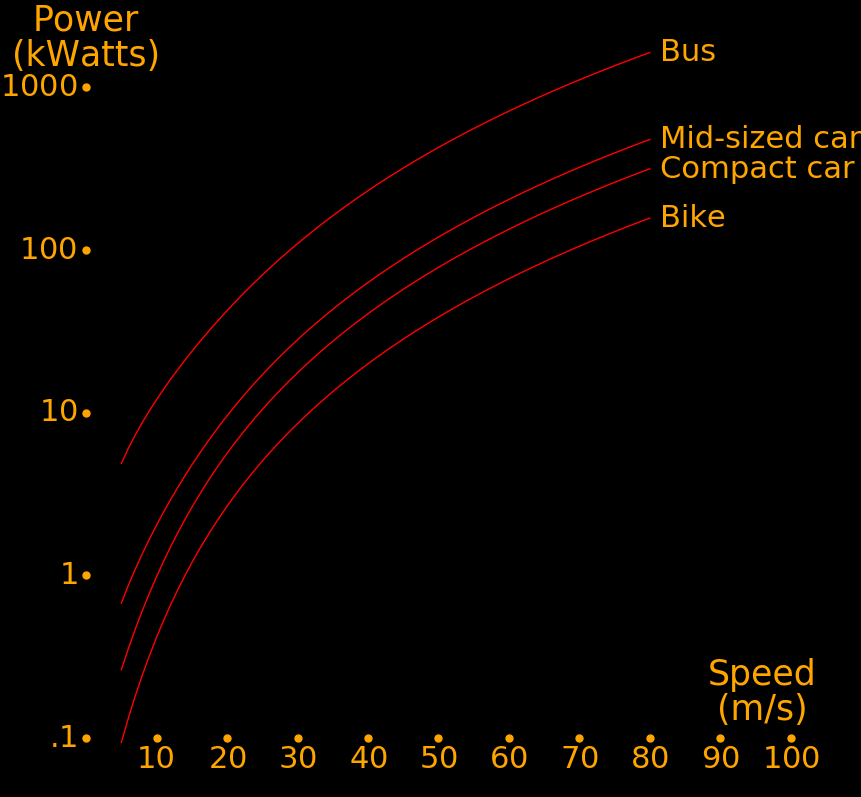
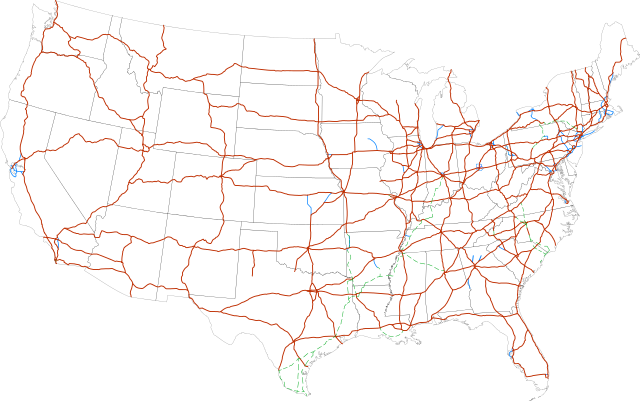
We need both EVs and GVs. EVs can't to long distance, and small GVs can't be quiet.
EVs are simple. Gasoline vehicles come with baggage like gears, powertrains, combustion, flywheels, mufflers, etc., none of which are present in EVs. In an EV, the powertrain is wires. Sports car manufacturers have embraced EVs.
For cities, noise is an issue. Small GVs are loud. Small EVs are ideal for cities.
Long-range freeway driving requires gasoline. Power scales as speed cubed and range scales as Speed-2.
 |
|---|
 |
 |
 |
 |
|---|---|---|---|
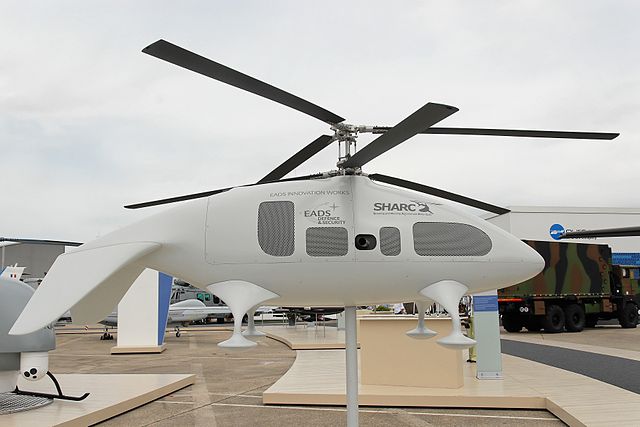
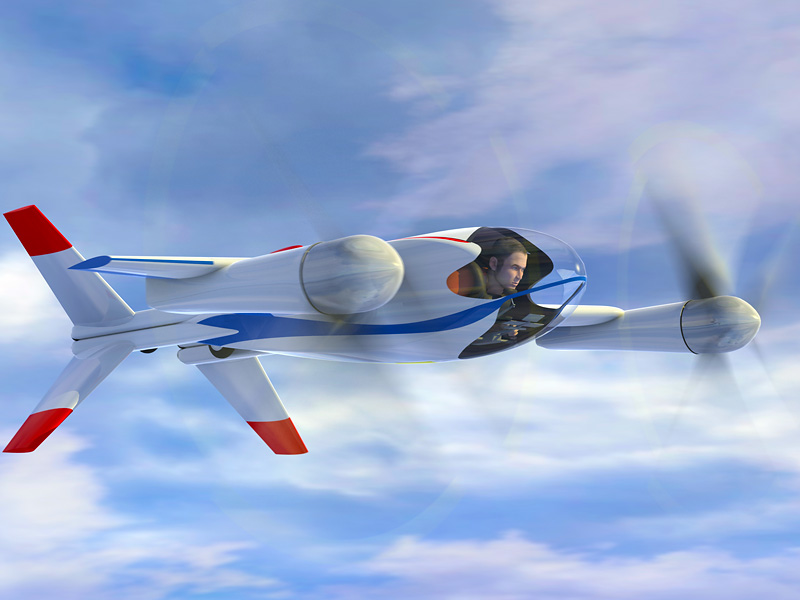
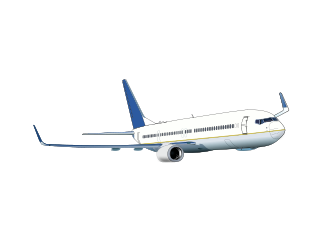
Flying cars give access to rugged rural terrain.
Flying electric cars are easy because lithium batteries have enough power/mass. For 1-person flying car, the minimum power/mass required to hover is 200 Watts/kg, and a lithium battery can produce 800 Watts/kg.
Electric motors contribute neglibly to the mass of the car because they have a power/mass much larger than the battery (7000 Watts/kg). The propeller weighs even less than the motor.
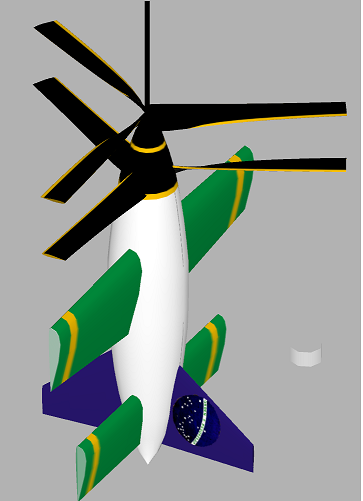
Because motors are easy, a flying vehicle can have many motors and propellers, which helps with safety. Also, the more propellers a vehicle has, the easier it is to fly, because it reduces the minimum power/mass required to fly. The minimum power/mass to fly scales as the number of propellers to the -1/6 power.
                             Power/Mass
                              Watts/kg

Minimum for fixed-wing flight   100
Minimum for hovering flight     200
Minimum vehicle power/mass      300   Should be easily able to hover. Use 1.5 times the minimum power/mass to shover
Lithium battery                 800
Electric motor                 7000
Electric generator              100
An electric generator can't power a flying car because the power/mass is too low.
The neutrons in a fission reactor can transmute elements and turn a cheap element into an expensive element. Neutron transmutation moves an element one spot to the right in the periodic table.
The most profitable transmutation is to turn tungsten into rhenium, osmium, iridium, platinum, and gold.
Tungsten is transmutable. Tungsten-186 has a large neutron capture cross section (35 barns).
Transuranic isotopes are useful for rocketry.
|
|---|
Burnt fission fuel is the new gold. It contains valuable palladium and rhodium, which are great catalysts. One kg of uranium costs $100 and produces $13000 of rhodium and $1600 of palladium. The elements produced by the fission of one kg of U-238 are:
               Mass   Value of   Value of element  Half life
                      element     in burnt fuel
               gram     $/kg          $/kg           year

Rhodium-103     26.1   500000      13000            Stable
Palladium-106   22.4    72000       1600            Stable
Xenon           44.6     1800         80            Stable       A mix of Xenon-131 and Xenon-132
Technetium-99   51.4        ?          ?            211000
Strontium-90    11.8        ?          ?                28.8
Rhodium and palladium are important as catalysts. Technetium is important because there are no stable isotopes and it doesn't occur in nature. Strontium-90 is important because it can be used as a radioisotope battery. Technetium-99 and Strontium-90 don't have well-established market prices because they only come from fission reactors. Xenon is easy to extract because it's a noble gas.
The numbers are for fission by fast neutrons. Fission by slow neutrons produces similar numbers.
The only nations engaged in large-scale reactor construction are China an India. China has never shut down a reactor. The USA shut down half of its reactors.
   Operational  Constructing  Shut  Aborted  Melt   Blew up
                              down           downs

USA       94       2         41      2         1             Three Mile Island
France    56       1         12      0
China     51      20          0      0
Russia    38       4          9     19
Japan     33       4         23      0         3             Fukushima
S Korea   24       4          2      0
India     20      10          1      0
Canada    19       0          6      0
Ukraine   15       2          3     13         1       1     Chernobyl
UK        13       2         31      7
Belgium    7       0          1      0
Czech Rep  6       0          0      0
Germany    6       0         30      4
Pakistan   6       1          0      0
Finland    4       1          0      0
Hungar     4       0          0      0
Slovakia   4       2          3      0
Argentina  3       1          0      0
Brazil     2       1          0      0
UAE        1       3          0      0
Iran       1       1          0      0
Turkey     0       3          0      0
Italy      0       0          4      2
N Korea    0       3          1      3
"Constructing" = Under construction
"Shut down" = Previously operational, then shut down
"Aborted" = Construction began but was aborted.
 |
 |
 |
 |
|---|---|---|---|
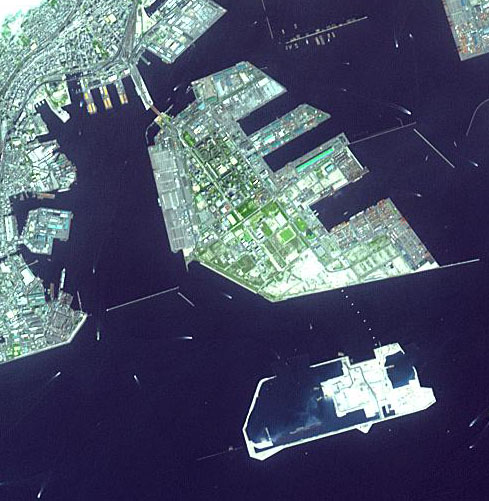
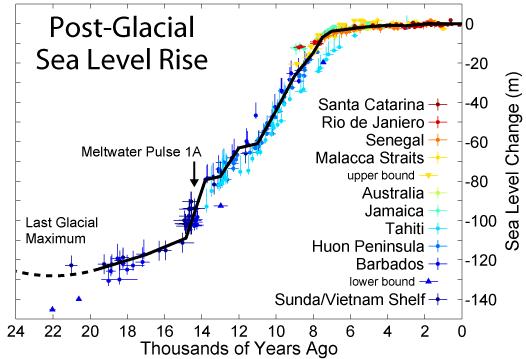
Sea level rise is easily countered by creating new land. The land lost to sea level rise is 53000 km3 and the land created artificially is 25000 km2. New land is usually worth more than the cost of creating it.
              Gain       Loss
              km2        km2

World         25000     53375
China         13500
Netherlands    7000
South Korea    1550
USA            1000
Japan           500      2190
Ecuador                 28500
Vietnam                 14700
Sweden                   3290
Iraq                     3070
Bulgaria                 2030
 |
|---|
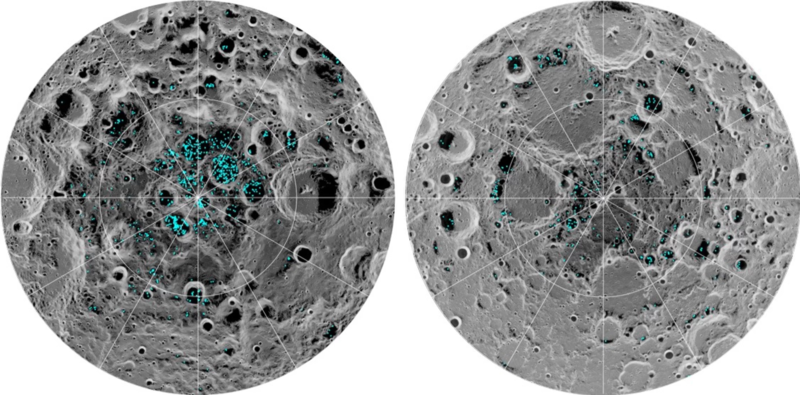
Solar system exploration begins with lunar ice, which can be used for rocket fuel, life support, and radiation shielding. The moon's low gravity makes it easy to launch ice into space. Lunar ice is converted into hydrogen + oxygen rocket fuel, moved to low-Earth-orbit, and used to help rockets go from there to other destinations. Article.
The moon likely has metal asteroid craters. We should be prospecting the moon.
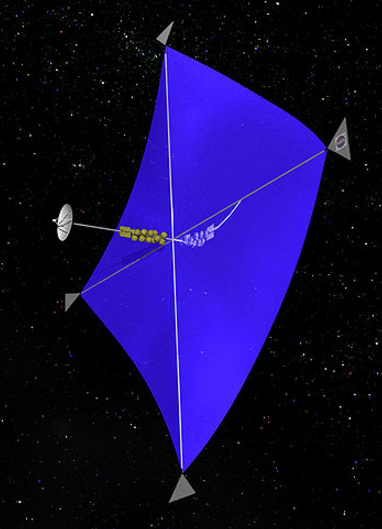
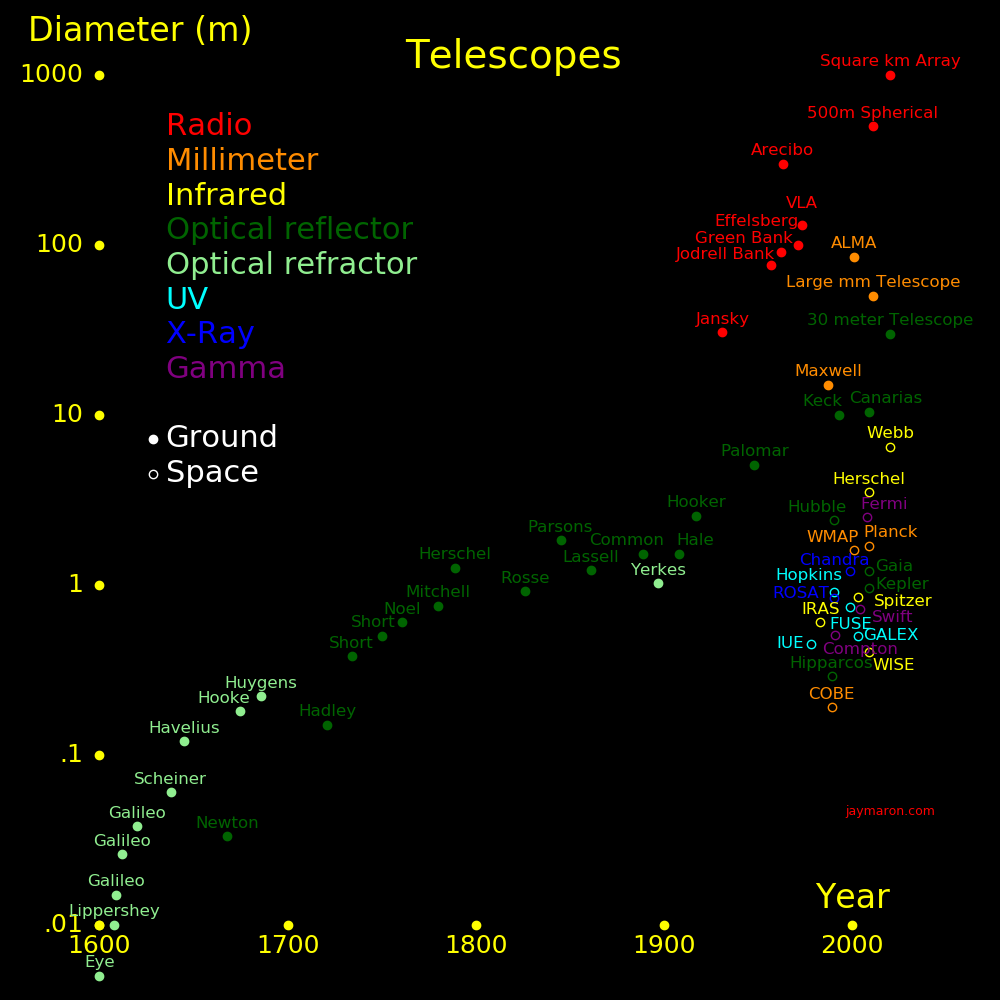
The ideal place for space telescopes is L2. We should have a manned base station at L2 to assemble colossal segmented telescopes on-site. Support the station with lunar ice.
 |
|---|
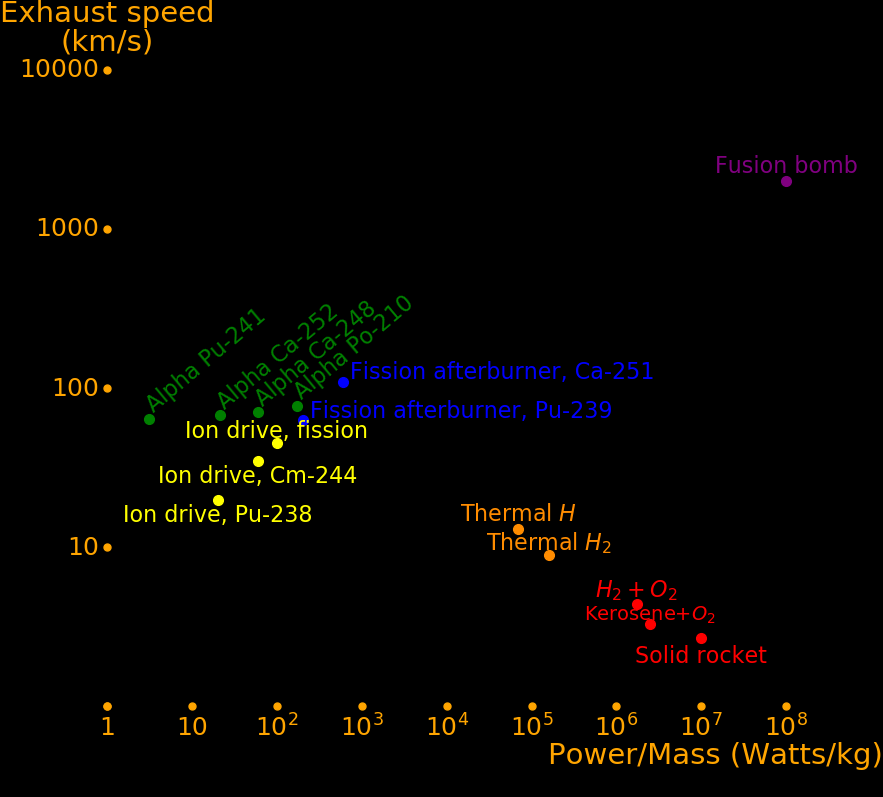
The future of rocketry is the fission hydrogen thermal rocket. Such a rocket has a higher exhaust speed than chemical H2+O2 rockets, and a higher power/mass than an ion rocket.
 |
|---|
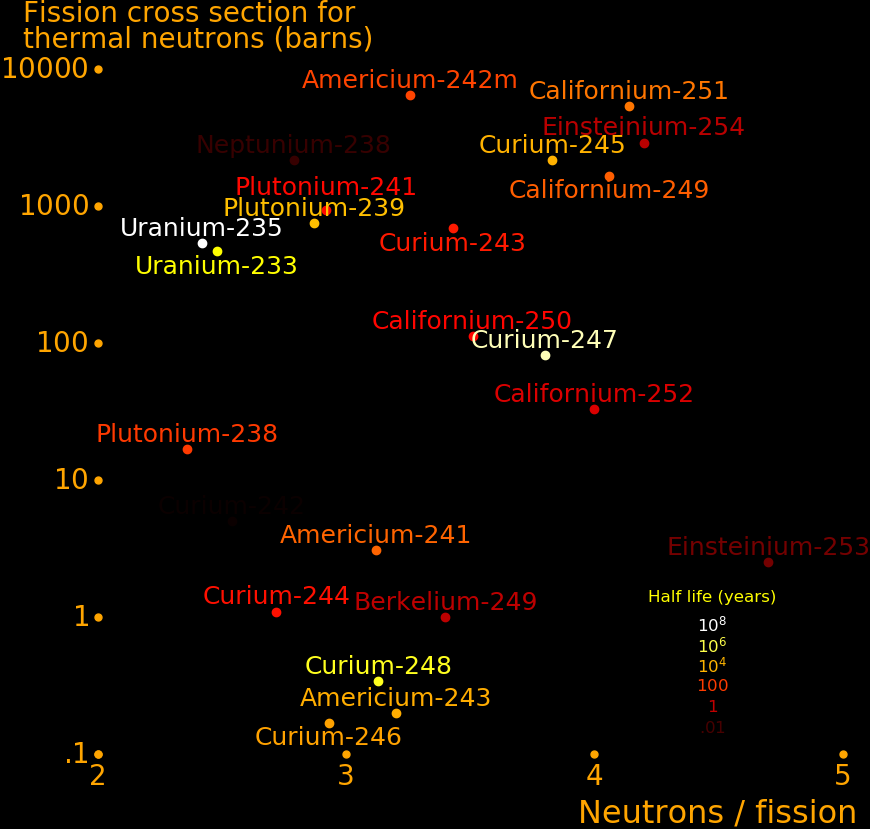
A hydrogen thermal rocket can be turbocharged with a fission afterburner. A fission reactor produces neutrons, and the neutrons trigger fission in the afterburner fuel. The fission fuel should have a large fission cross section, for example californium-251, americium-242m, and californium-249.
The reactor that produces the neutrons should have a large value for neutrons/fission, for example californium-251, curium-245, and californium-249.
 |
|---|
The American frontier was opened by rail. The frontier of the future is space.
SpaceX has the world's lowest launch cost at $2300, and they lead the world for material launched to orbit. The table shows the total payload launched to orbit in 2020. SpaceX outlaunches NASA and China. SpaceX also has no fails from 2020.
Many oligarchs that are not named Musk have rocket companies, but they are all dwarfed by SpaceX.
The future of launch is air launch. Air launch allows you to start from above most of the atmosphere, and you can go horizontal immediately.
Tons launched to orbit for 2022, up to October 6.
                       Payload
                        tons

China    National        193
Russia   National         84
Europe   National         40
S Korea  National          3
India    National          2
Japan    National          0
Canada   National          0

America  SpaceX          989   Elon Musk
America  ULA             108   United Launch Alliance  =  Lockheed Martin & Boeing
America  Northrup Grumman  8
America  Rocket Lab        2   Peter Beck
America  Firefly           1
America  Virgin Orbit      1
America  Blue Origin       0   Jeff Bezos
America  Stratolaunch      0   Paul Allen and Burt Rutan
America  VOX               0
America  NASA              0
America  Relativity Space  0
America  Astra             0
America  ABL               0
 |
|---|
In a metal asteroid, the most valuable metals are osmium, rhodium, nickel, platinum, and palladium.
A cubic metal asteroid 100 meters in size has a mass of 1 billion kg, and the value of the metals is:
         Concentration   Value    Value in asteroid
             ppm         $/kg         Billion $

Osmium         7.6     1600000      12
Rhodium        4.1      500000       2.0
Nickel     67000            16       1.1
Platinum      19         35000        .7
Palladium      3.8       72000        .3
Cobalt      6300            33        .2
Iron      910000              .15     .1
 |
|---|
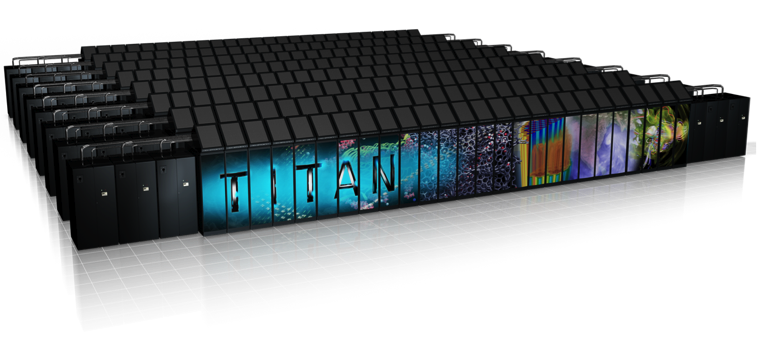
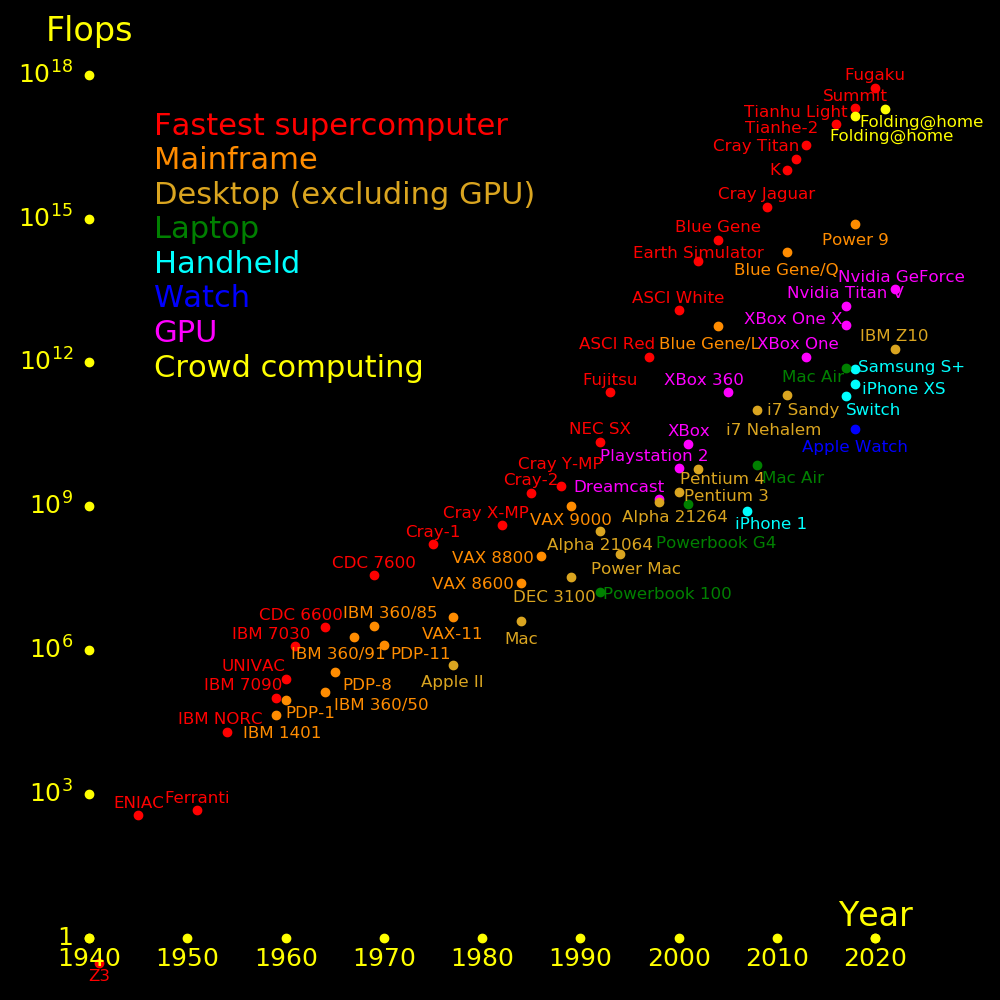
Supercomputers are critical to weather prediction and climate modeling. The farther ahead we can predict weather, the greater the economic payoff.
Supercomputing is driven by speed/$ and mobile computing is driven by speed/power.
Speed per dollar        =    2  GFlop/$      (CPU)
Speed per dollar        =   40  GFlop/$      (GPU)
Memory, RAM             =   .2  GByte/$
Memory, solid state     =    7  GByte/$
Memory, disk            =   33  GByte/$
Speed per power         =  200  GFlop/Watt   (GPU)

Battery energy per mass = 1000  MJoule/kg
Battery power  per mass = 1000  Watt/kg
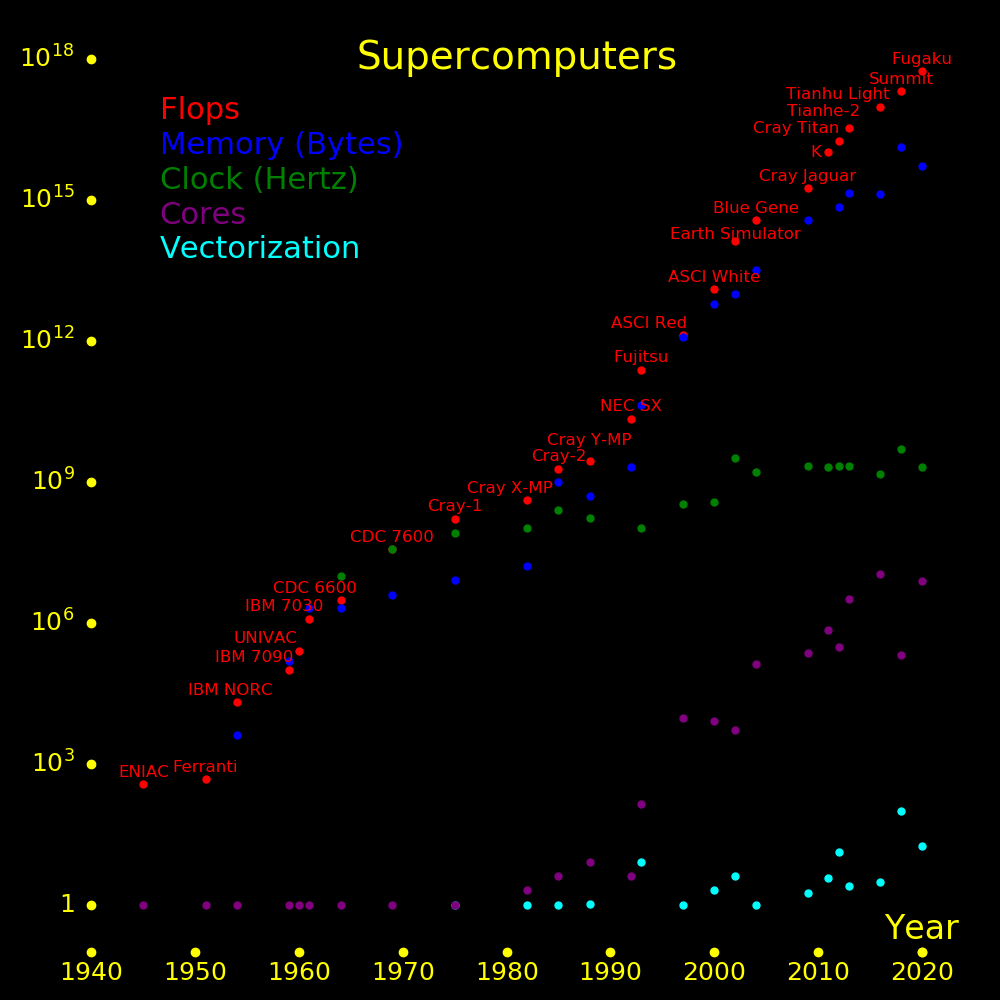
The speed of a supercomputer is
Supercomputer speed = S = 2FCV    Floating point operations per second
Clock frequency     = F           Hertz
Cores               = C           Number of independent cores
Vectorization       = V           Number of vectors per core. Vectors aren't independent. They all execute the same task
Clock speed is not increasing. Vectorization is increasing.
 |
|---|
China has never shut down a nuclear reactor
Only China and India are engaged in large-scale reactor construction.
Nations that have shut down or aborted a large number of reactors include USA, UK, Germany, Japan, Russia, and Ukraine.
"Constructing" = Under construction
"Shut down" = Previously operational, then shut down
"Aborted" = Construction began but was aborted.
    Operational  Constructing  Shut  Aborted  Melted
                               down            down

  USA       94       2         41      2
  France    56       1         12
  China     51      20
  Russia    38       4          9     19
  Japan     33       4         23                3     Fukushima
  S Korea   24       4          2
  India     20      10          1
  Canada    19                  6
  Ukraine   15       2          3     13         1     Chernobyl
  UK        13       2         31      7
  Belgium    7                  1
  Czech Rep  6
  Germany    6                 30      4
  Pakistan   6       1
  Finland    4       1
  Hungar     4
  Slovakia   4       2          3
  Argentina  3       1
  Brazil     2       1
  UAE        1       3
  Iran       1       1
  Turkey             3
  Italy                         4     2
  N Korea            3          1     3
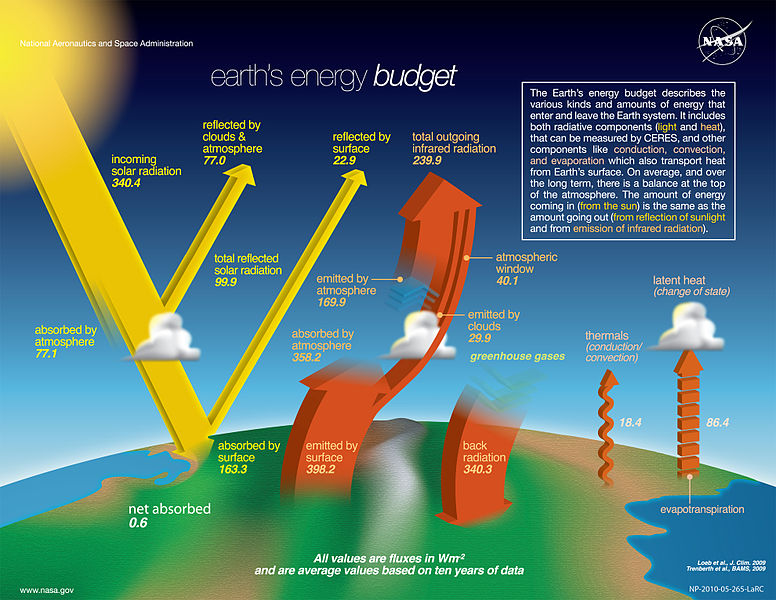
Adding 1 kg carbon to the atmosphere increases greenhouse heating by 4.1 Watts.
There are 2 classes of geoengineering: Carbon management (usually trees) and greenhouse warming management (usually cloud seeding and aerosols). The above number allows you to compare costs.
A tree captures carbon at a rate of .5 kg/meter2/year, which decreases greenhouse heating by 2.0 Watts/meter2.
"Albedo" is reflectivity.
The difference in reflected flux between trees and grass is measured to be 8
Watts/meter2 at 40° latitude, where solar flux is 190
Watts/meter2, and this corresponds to an albedo difference of .04.
Williams, Gu, &
Jiao (2021).
If you replace an arctic conifer tree with snow, the albedo change is
".52". The average solar power at 60° latitude is 110
Watts/meter2, so the change in power is 57
Watts/meter2. This the most extreme case. The realistic change is
less, because there isn't always snow on the ground, and because trees are
sometimes covered in snow.
The density of a typical forest is:
The growth rate of a typical forest is:
Wood is 1/2 carbon and 1% nitrogen.
The fertilizer requirement for nitrogen is:
Trees also need potassium, phosphorus, calcium, magnesium, and sulfur, and
their total cost is similar to that of the nitrogen. The total fertilizer cost
is double the nitrogen cost.
Bamboo is a fast-growing tree and it's easily harvested, because it's light on side branches.
A new bamboo forest achieves full leaf coverage early, whereas an oak forest takes longer.
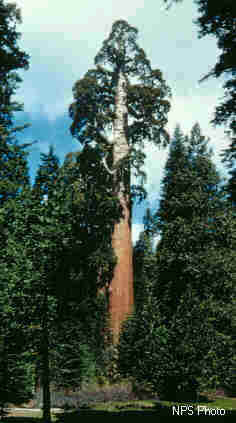
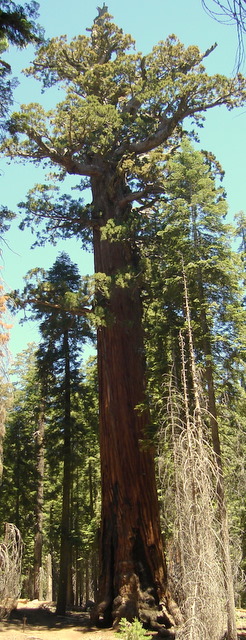
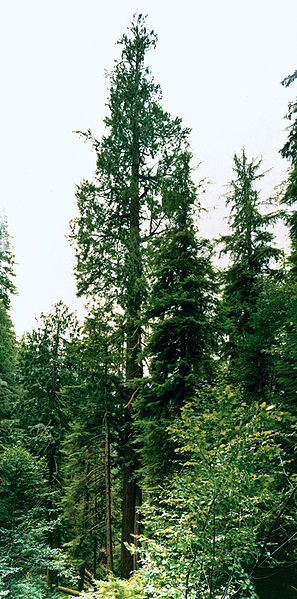
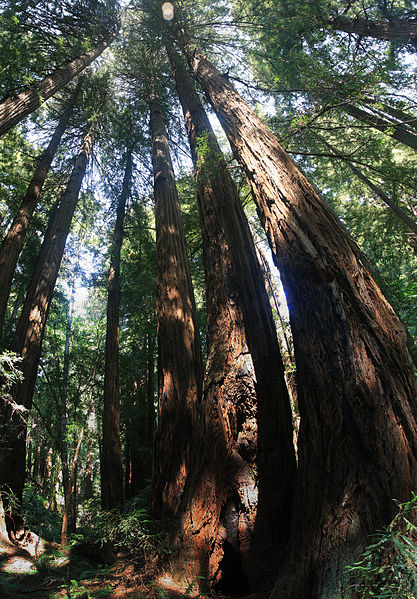
The largest trees are sequoias, redwoods, douglas firs, and eucalyptus. Douglas firs
can grow in the arctic.
Trees should be planted close to water. For existing trees, fertilizer should
go to large trees that are close to water.
If possible, plant trees so that their shadows are cast over water, because
trees have a larger albedo than water.
Plant trees that produce nuts, because birds are more likely to get the nuts
than insects. Also, the more birds, the fewer insects.
An old forest is carbon-neutral and a young forest captures carbon. Replace old forests
with young forests, or harness the deadwood in old forest.
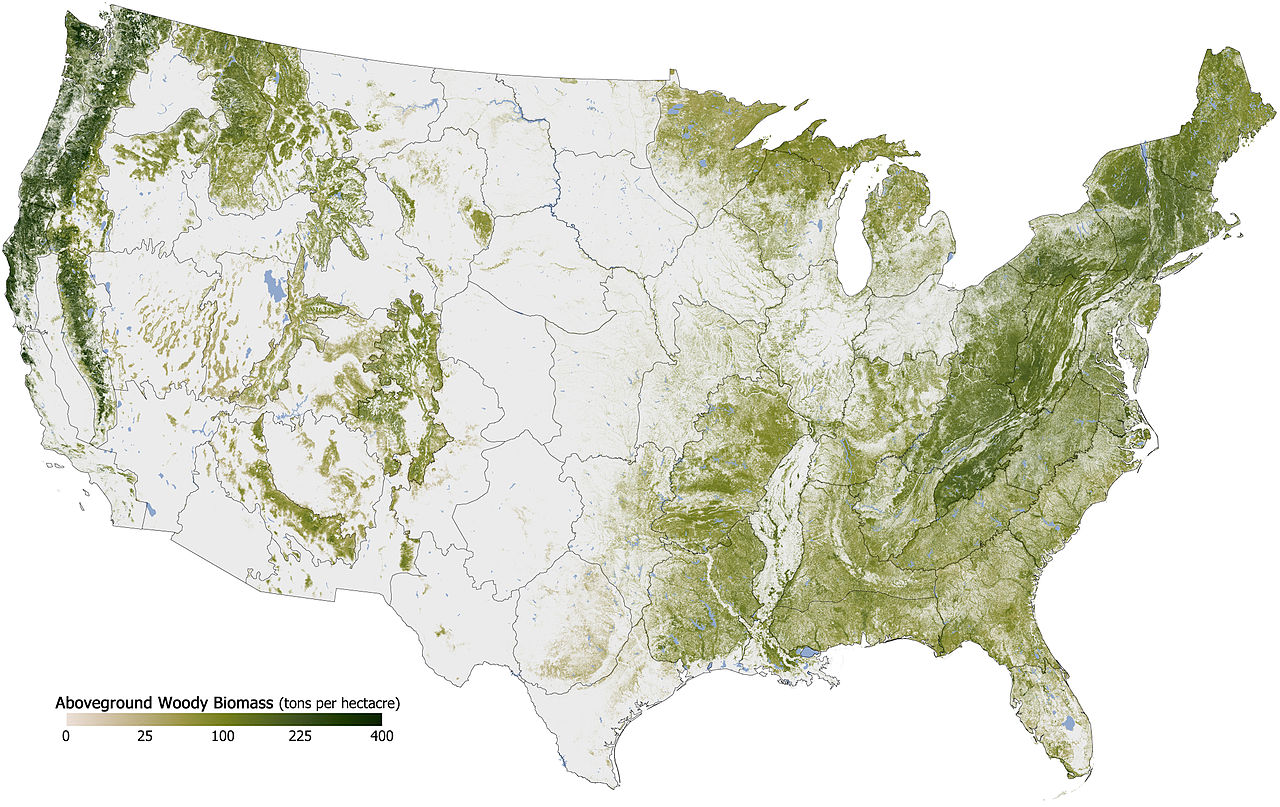
World forest carbon:
Using trees to offset atmospheric carbon gain requires 4 Mkm2 of
forest, and world forests total 39 Mkm2. Forests capture carbon at a
rate of .5 kg/meter2/year.
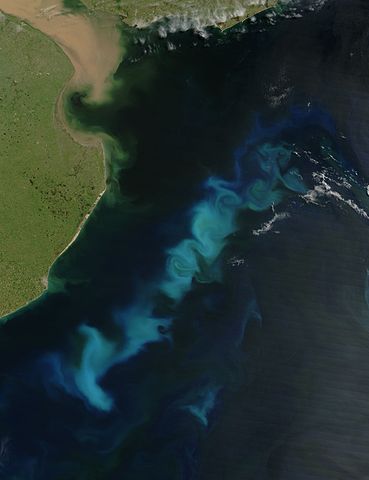
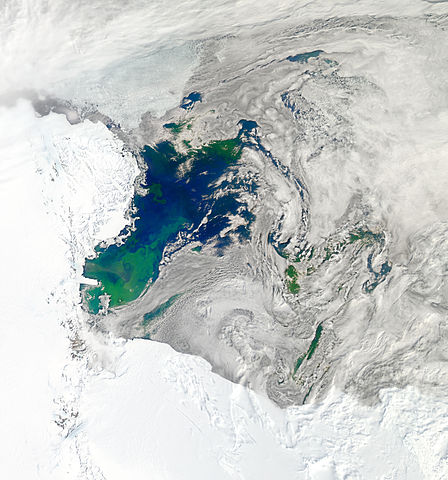
Fertilizing the ocean with iron causes large-scale biomass growth, and when it dies it takes the carbon to
the bottom of the ocean.
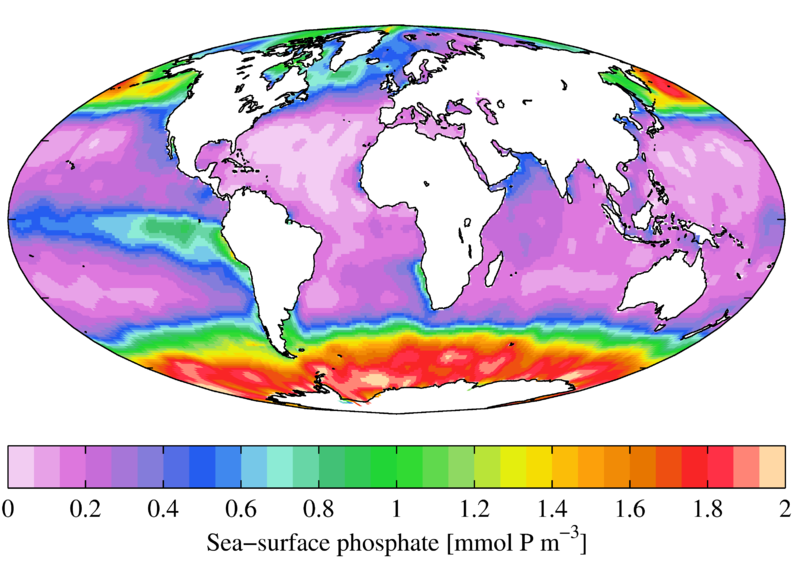
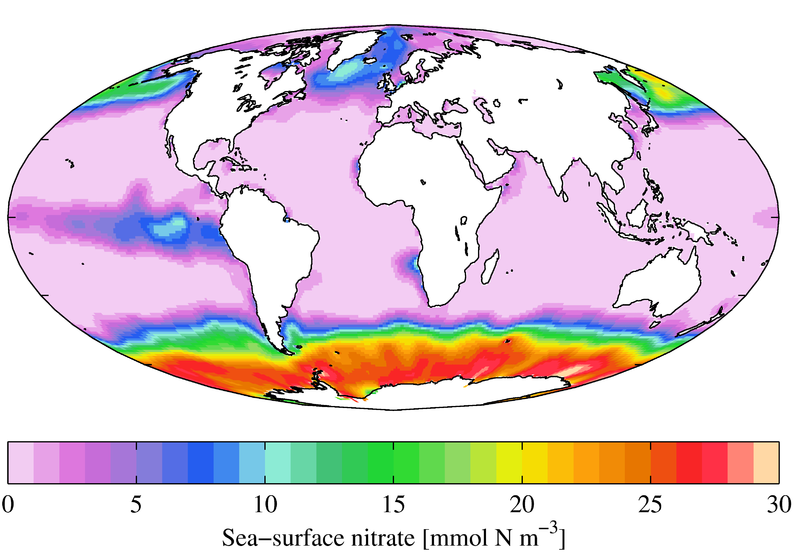
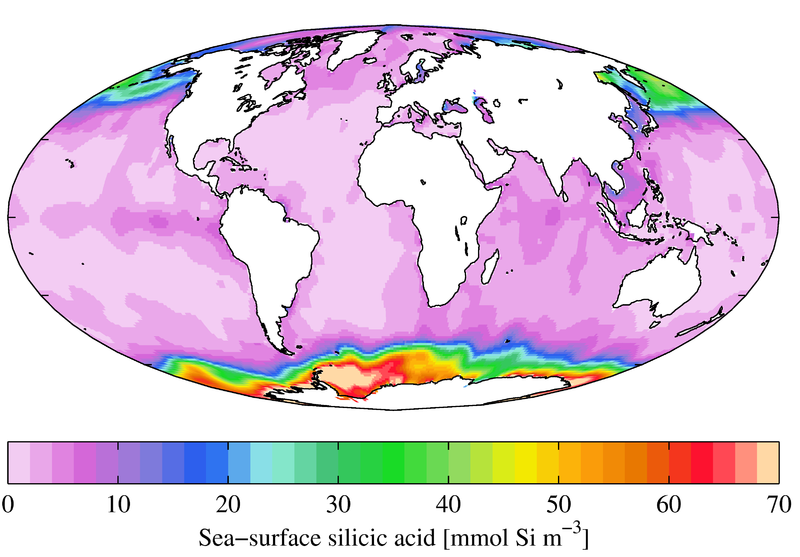
In the ocean the microbe nutrient requirement is:
Iron is insoluble in the ocean and is usually the limiting nutrient. Between
nitrogen and phosphorus, nitrogen is usually the limiting nutrient.
A small amount of iron fertilizer can capture a large amount of carbon.
Diatoms are microbes with silicon walls as opposed to conventional lipid membranes.
If silicon is present then silicon microbes outcompete lipid microbes because
silicon walls cost 8% as much energy to make as lipid membranes.
Diatoms are good carbon fixers because when they die they sink to the bottom of the ocean,
and the carbon stays there.
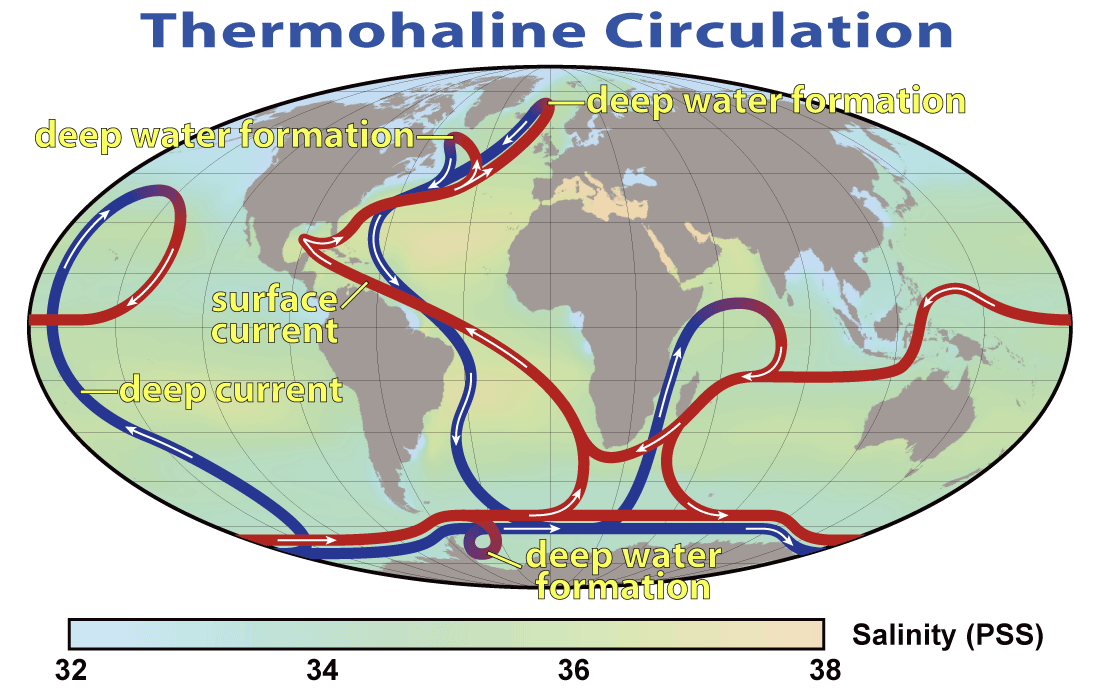
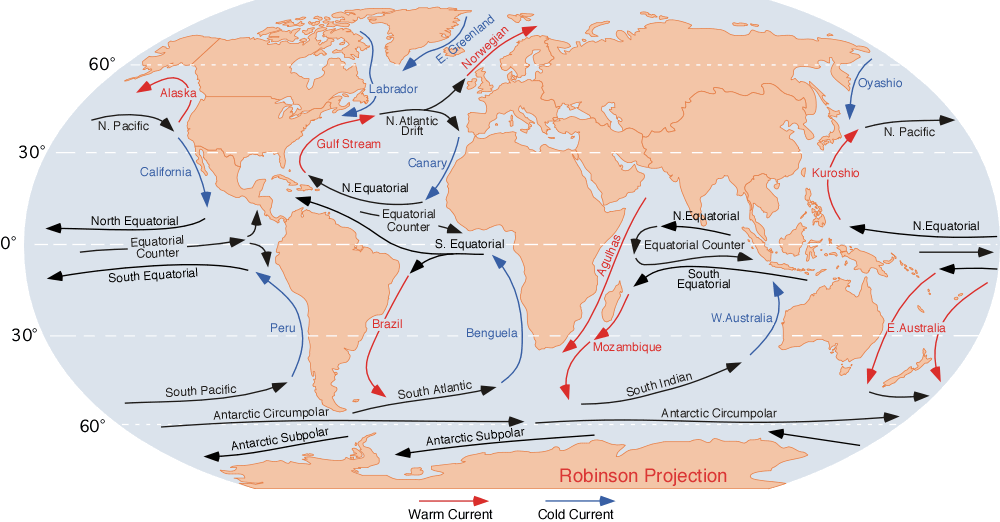
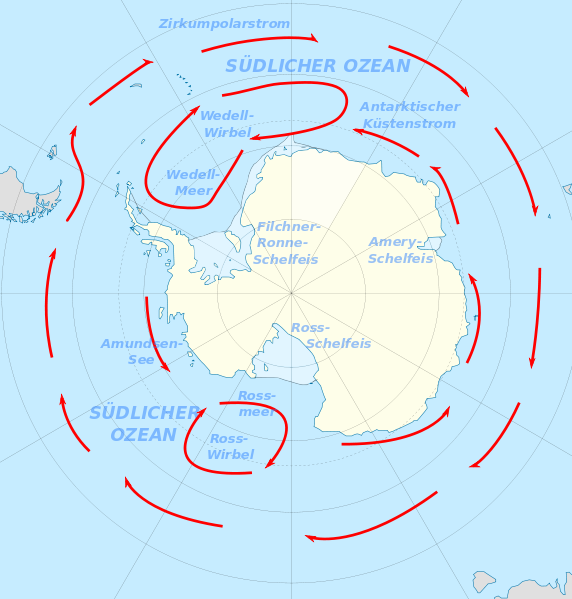
The best place to fertilize the ocean with iron is the Antarctic Atlantic, where iron is
scarce and silicon, nitrogen, and phosphorus are abundant. This is also the region where the
ocean currents flow downward.
Ocean concentrations of phosphorus, nitrogen, and silicon:
Jet Propulsion Laboratory designed a space mirror with the goal of minimizing the
mass per area. It consists of mylar coated with aluminum.
A space mirror can cool the Earth. Greenhouse gases generated by humans have
increased the sun's effective brightness by 1.5 Watts/meter2. The
size of a mirror required to cancel this is 560000 km2, which costs
3.4 trillion dollars to launch.
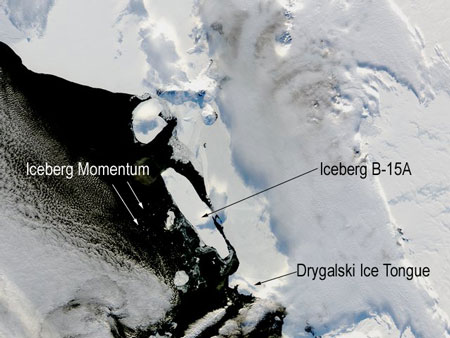
Antarctic icebergs can be moved to places in the tropics where sun is abundant but water is scarce.
The energy required to move the iceberg costs far less than the value of the freshwater delivered.
Ocean currents can help save energy. The South Indian Current brings icebergs to Australia,
The South Pacific current brings icebergs to Chile, and the South Atlantic current brings icebergs
to Africa.
We calculate the energy required to move an iceberg for a typical iceberg.
The iceberg should move as slow as possible but it should move fast enough to
reach its destination before melting. We assume a travel time of 1 year, and
this determines the velocity. Presumably, measures can be taken to slow
melting such as covering the iceberg with a white tarp.
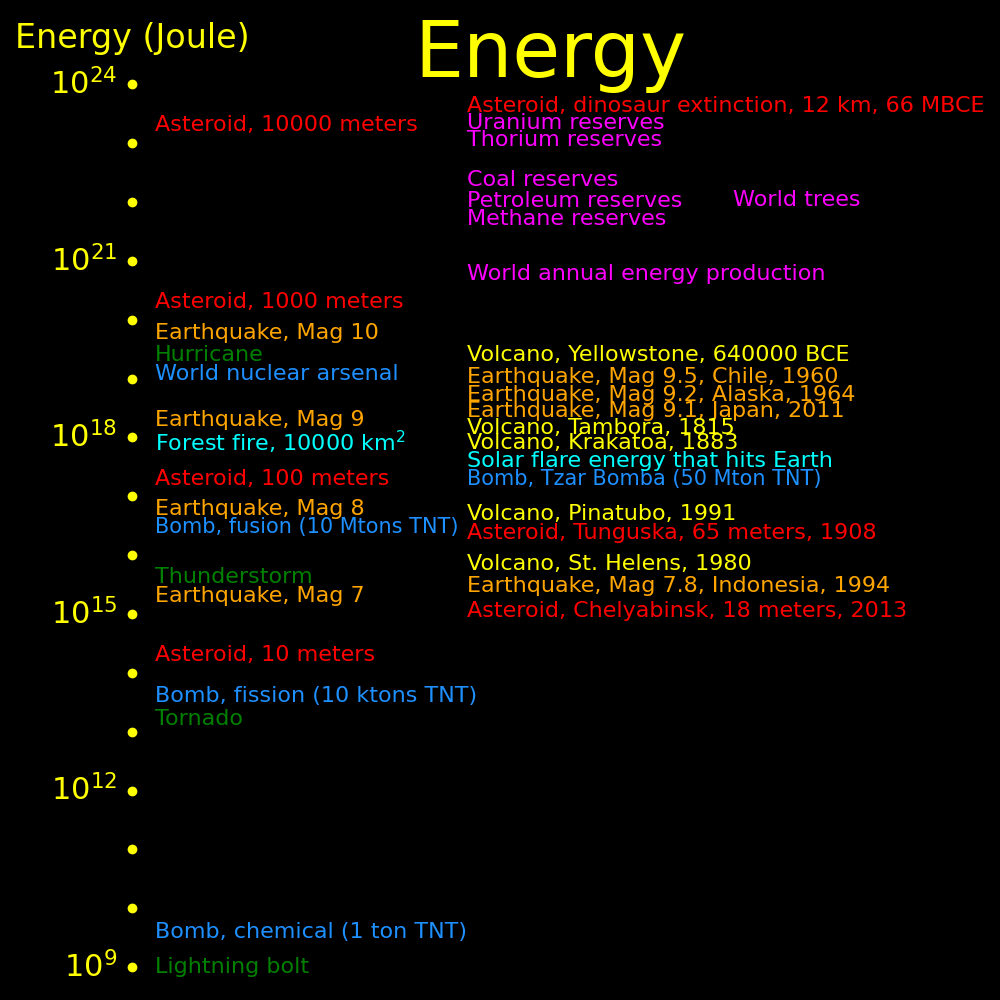
Asteroids have vast kinetic energy. A 1 km asteroid has as much energy as America's yearly output.
Asteroid energy can be harnessed with a lake. An asteroid blasts water out
of a lake, then hydro energy is extracted as the lake refills.
Asteroids can make a crater and a new lake, and it can make it deep.
The deeper the better.
The ejected water should be freshwater so that it can irrigate
or make snow.
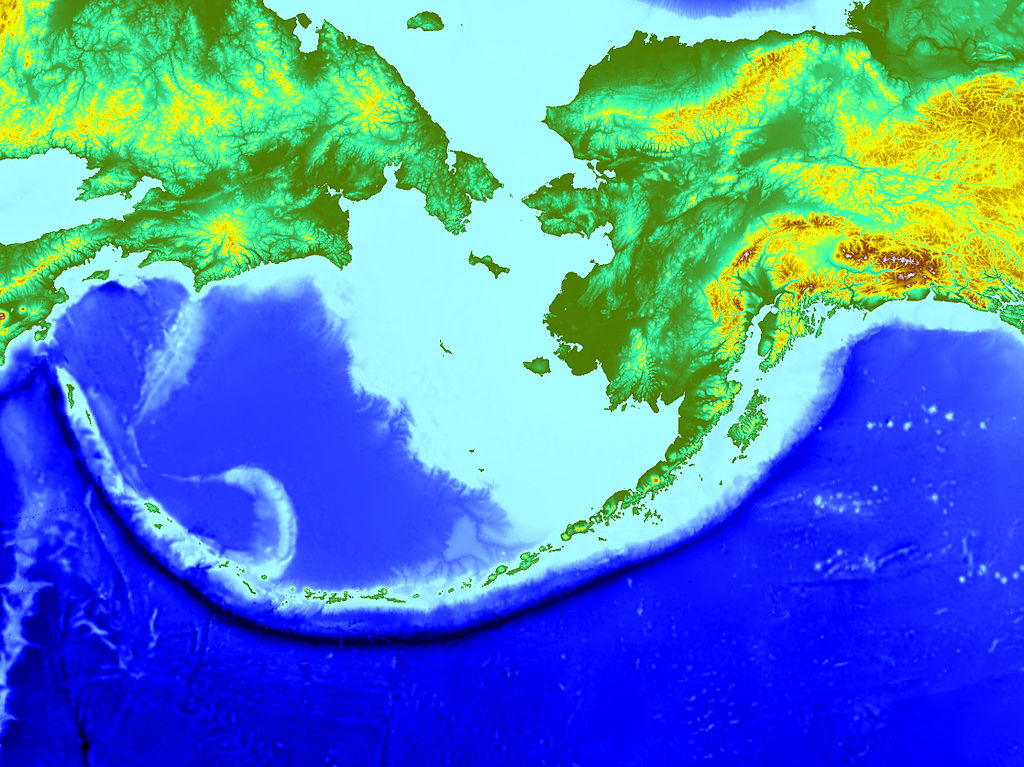
You need a big source of freshwater to extract the hydropower. The lake should be
near a large river. The Yukon and MacKenzie rivers are large and in lightly-populated
territory. Alaska is already earthquake prone.
The asteroid should be large enough to matter, but not large enough to cause
excessive damage. The sweet spot is an asteroid around 300 meters in size,
which makes a crater around 5 km in diameter and .5 km deep.
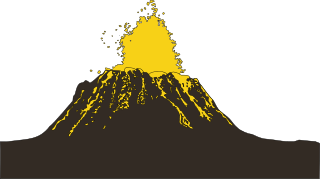
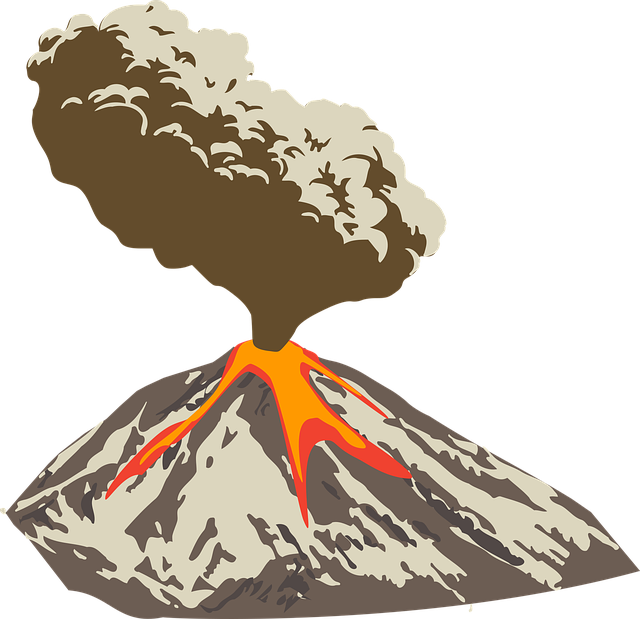
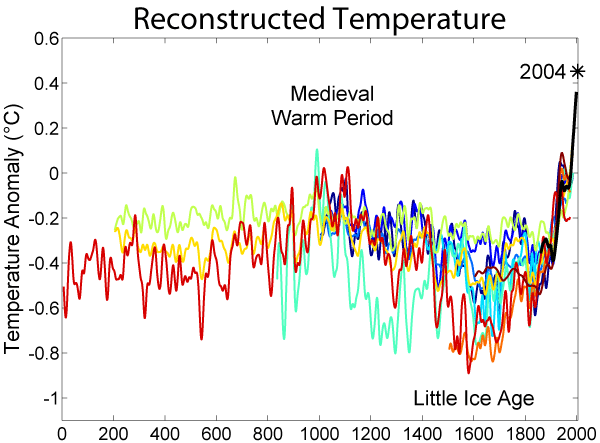
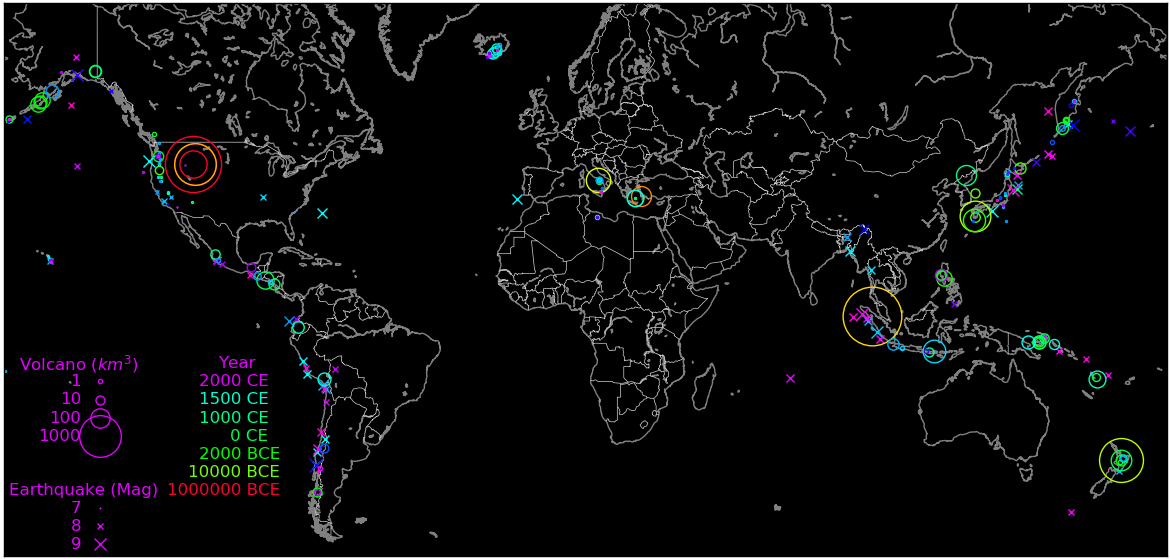
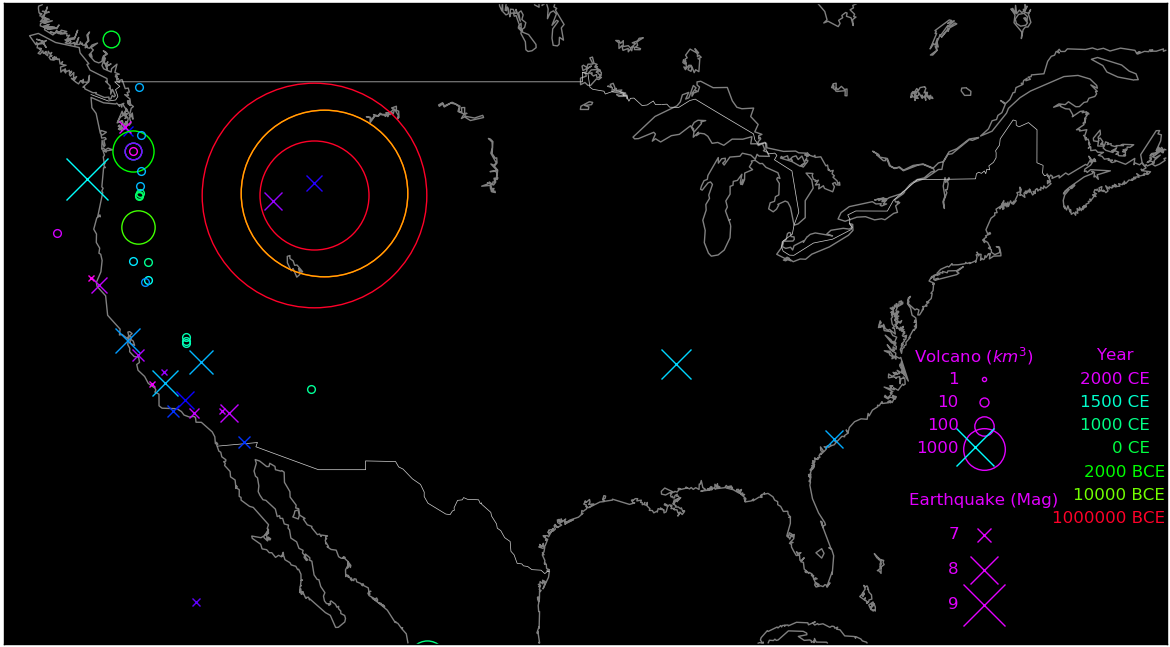
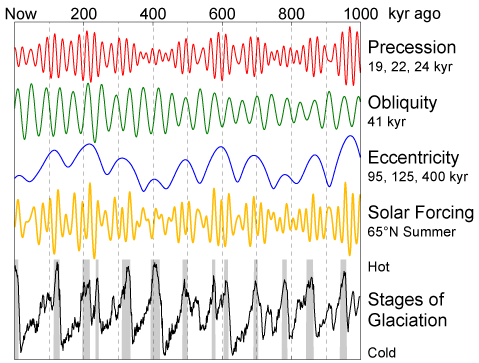
Volcanoes often cause global cooling, and the charts show historical
cooling events.
The "medieval warming period" had low volcanic activity.
Canada fills with snow by October. If you hit a lake in Canada in September, you
can make early snow and decrease the Albedo.
Meteors can uncover deep coal. Hilt's law states that the deeper the coal, the
higher the quality tends to be. When coal is formed, the higher the formation
temperature, the higher the quality.
The principal obstacles to deep mining are pumping water, and cooling.
Asteroid strip mining solves both problems.
The water launched by an asteroid strike can irrigate. 1/5 of rain that falls on
land becomes rivers and lakes and it can be put back in the atmosphere.
Aerosols such as sulfuric acid cool the Earth if they're in the stratosphere.
An asteroid strike can launch aerosols.
                 Albedo

Water             .07
Forest, conifer   .10
Forest, deciduous .16
Grass             .20
Crop              .20
Snow              .62
Latitude     Power at Earth surface, averaged over the year, in Watts/meter2.

    0          230
   15          250
   30          210
   45          180
   60          110
Wood density           =   11  kg/meter2
Wood energy/mass       =   20  MJoule/kg
Wood energy/meter2     =  220  MJoule/meter2
Wood value/kg          = .036  $/kg
Wood value/meter2      = .4    $/meter2
Wood production rate   =  1.0  kg/meter2/year
Energy production rate = 20    MJoule/meter2/year  =  .6 Watts/meter2
Wood nitrogen mass fraction     = n       =  .01
Price of nitrogen in fertilizer = p       = 5.7   $/kg
Nitrogen price / kg wood        = P = p n =  .057 $/kg
          World fraction  Forest  Deforestation  Fires
                %          Bkg       Bkg/yr      Bkg/yr

South America   22        96000        400         50
Russia          21        92000          ?        100
Africa          17        73000        240         50
Canada          12.6      55000          0         50
USA              7.9      34800          0         15
S.E. Asia        5.9      26000       -120         10
China            5.3      23300       -170         20
E.U.             4.1      18000        -40          3
Asian Islands    3.6      15800         30         10
Australia + NZ   3.2      14100          ?         20
C. America       2.7      11900         60          5

World            1000    440000        350        250
Carbon in atmosphere               = 880  trillion kg
Carbon in plants                   = 550  trillion kg
Carbon in trees                    = 500  trillion kg
Total human-generated carbon       = 300  trillion kg

Forest carbon capture rate         =  45  trillion kg/year
Atmospheric carbon increase rate   =   4  trillion kg/year

World forest area                  =  39  million km2
New forest neeeded to offset carbon=   4  million km2

Deforestation rate                 = .35  trillion kg/year

Total wood carbon harvested        =4.56  trillion kg/year     Wood for power + wood for industry
Wood carbon for biomass power      =1.59  trillion kg/year
Wood carbon for industry           =2.97  trillion kg/year
Element     Relative mass

Carbon        1
Nitrogen       .18
Phosphorus     .024
Iron           .000044

Mirror surface density =     6  grams/meter2
Mirror thickness       = .0043  mm       (Mylar coated with aluminum)
Mylar density          =  1.39  g/cm3
Aluminum density       =  2.70  g/cm3
Greenhouse gas forcing preindustrial          =   1.5 Watts/meter2
Greenhouse gas forcing now                    =   3.0 Watts/meter2
Solar forcing change                = I       =   1.5 Watts/meter2
Solar forcing increase rate                   =  .031 Watts/meter2/year
Earth surface area                  = A       =   510 Million km2
Solar power change                  = P = IA  =   765 TWatts
Solar intensity                     = I       =  1361 Watts/meter2
Mirror area                         = A = P/I =560000 km2   =   (750 km)2
Mirror mass/area                    = D       =  .006 kg/meter2
Mirror mass                         = M = DA  =   3.4 billion kg
Launch cost per kg                            =  1000 $/kg
Mirror launch cost                            =   3.4 trillion $
_(NSF).jpg)
Energy required to move an iceberg = Constant * Distance moved * Velocity2
Iceberg height           =  Z               =    .5 km
Iceberg sice length      =  X               =    10 km
Density of ice           =  d               =   917 kg/m3
Density of seawater      =  D               =  1025 kg/m3
Iceberg mass             =  M  = d X2 Z     =    46 trillion kg

Iceberg distance traveled=  L               =  1000 km     (Assume ocean currents help)
Iceberg travel time      =  T               =     1 year
Iceberg speed            =  V  =  L/T       =   .03 m/s

Drag force               =  F = ½ D X Z V2  =   2.3 million Newtons
Drag energy              =  E  =  F L       =  2300 GJoules
Drag power               =  P  =  F V       =    69 kWatts
Energy cost              =  e               =    36 MJoules/$
Freshwater value per kg  =  z               = .0001 $/kg
Iceberg freshwater value =  Z  =  M z       =     5 billion $


![]()
Region        Volcano   Magma  Volcanic  Year  Temp   Sulfur dioxide   Energy
                        (km3)   index        change (K)    Bkg         Joule

Philippines   Pinatubo      25   6     1991     -.2       20           5e16
Mexico        El Chicon      1.1 5     1982                7           2e16
USA           Saint Helens   4.2 5     1980
Alaska        Novarupta     28   6     1912     +.2
Guatemala     Santa Maria   20   6     1902     -.1
Indonesia     Krakatoa      20   6     1883     -.4                    8e17
Indonesia     Tambora      160   7     1815     -.5                    3e18   Caused the "Year without a summer"
Iceland       Laki          14   6     1783    -1
Peru          Huenaputina   30   6     1600
Vanuatu                    108   7     1452
New Zealand   Tarawera           5     1315                                   Famine of 1315-1317
Indonesia     Rinjani       10   7     1258                                   Caused the Little Ice Age that ended the Viking era
Iceland       Hekla 3        1   5     1159
North Korea   Paektu       110   7      946
Iceland       Laki          18   4      934
Unknown                          7      535    -2
New Zealand   Taupo        110   7      233
Aegean Sea    Santorini     60   7    -1575                                   Possible cause of the Greek dark age
Japan         Kikai        150   7    -4350
Antarctica    Erebus             6   -16000
New Zealand   Taupo       1170   8   -24500                                   Most recent magnitude 8 event
Indonesia     Lake Toba   2800   8   -72000    -1
Yellowstone   Yellowstone 1000   8  -640000
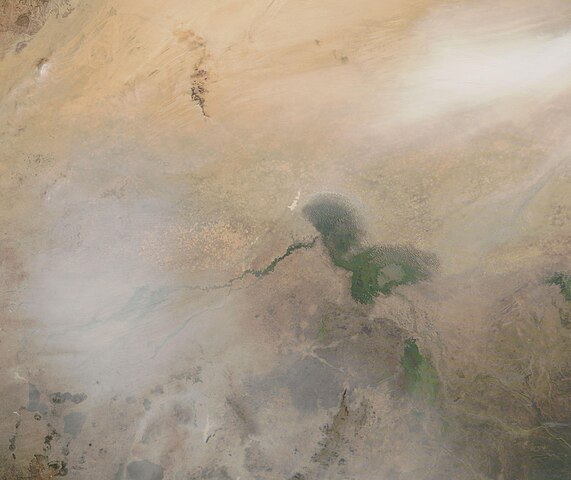
An asteroid impact on a nutrient deposit launches nutrients and fertilizes the Earth. The macronutrients are phosphorus, potassium, magnesium, and calcium. Among them, phosphorus is the best choice for asteroid fertilizing. The Earth's crust averages 1.05 ppt phosphorus and good phosphorus ore is of order 80 ppt phosphorus.
A good place to hit is the Bodele depression, which is rich in nutrients. Wind carries dust to the Amazon at a rate of 210 Bkg/year.
 |
|---|
Lake Chad recently reduced in size, exposing nutrient deposits. Wind stirs up dust and blows it to the Amazon.
|
|---|
A metal asteroid landing on Earth solves the world's iron problem and save us energy on smelting. Metal asteroids also have platinum-group metals, which are great catalysts.
Metal asteroids are dominantly iron, nickel, and cobalt, and this is good alloy. In 1 kg of asteroid,
          Mass       Metal       Value
          gram       $/kg          $

Iron        910            .75     .68
Nickel       67          16       1.07
Cobalt        6.3        33        .21
Platinum       .19    35000       6.6
Osmium         .0076  1600000    12.1
Rhodium        .0041  500000      2.05
Palladium      .0038   72000       .27
|
|---|
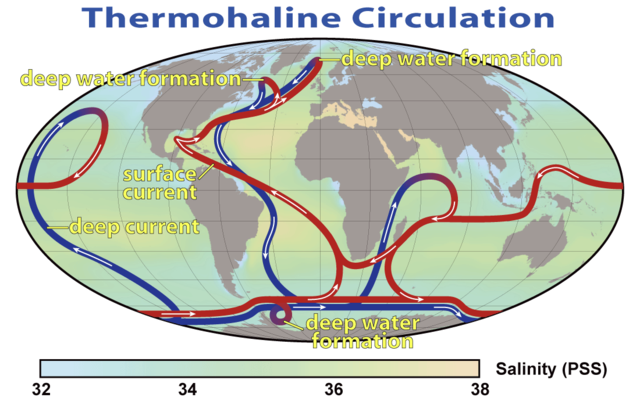
The Pacific and Arctic oceans don't have a deep-water connection because of the Aleutian archipellago. An asteroid can open a gap and enable deep-water circulation, enriching the deep oceans with oxygen.
 |
|---|
 |
|---|
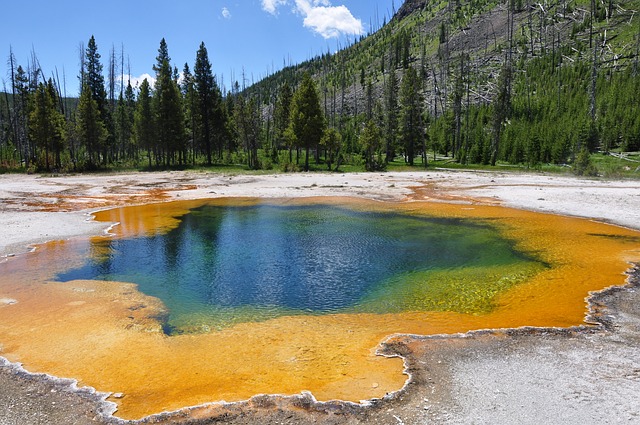
A small asteroid can expose a hotspot and access geothermal energy. A big asteroid can make its own hot spot. A hot spot in the arctic can make steam heat.
 |
|---|
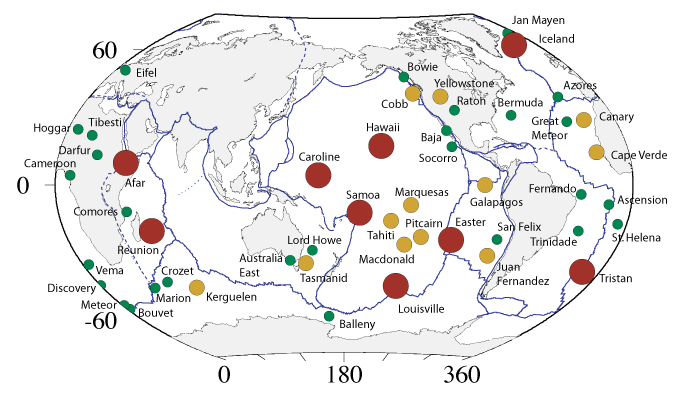
The only hotspots that are in sparsely inhabited territory are in the Sahara, and there are 4 of them.
A volcano that has a danger of erupting can be triggered with an asteroid. You know when the asteroid will hit and you can evacuate. This can also be done with earthquakes.
The Yellowstone hotspot is 20 GWatts.
Human civilization              =  8e20  Joule/year
Asteroid energy, 1 km size      =  2e20  Joule
Hotspot heat energy, 10 km size =  3e22  Joule

Rock heat capacity              =  2000  Joule/Kelvin
Rock temperature change         =   500  Kelvin
Rock heat storage               =     1  MJoule/kg
Hot spot diameter               =    10  km
Hot spot mass                   =  3e15  kg
An asteroid can trigger volcanoes or earthquakes. You know when the stike will happen and you can evacuate.
 |
|---|
 |
|---|
Asteroids can be propelled with hydrogen bombs. Article.
|
|
|---|---|
 |
|---|
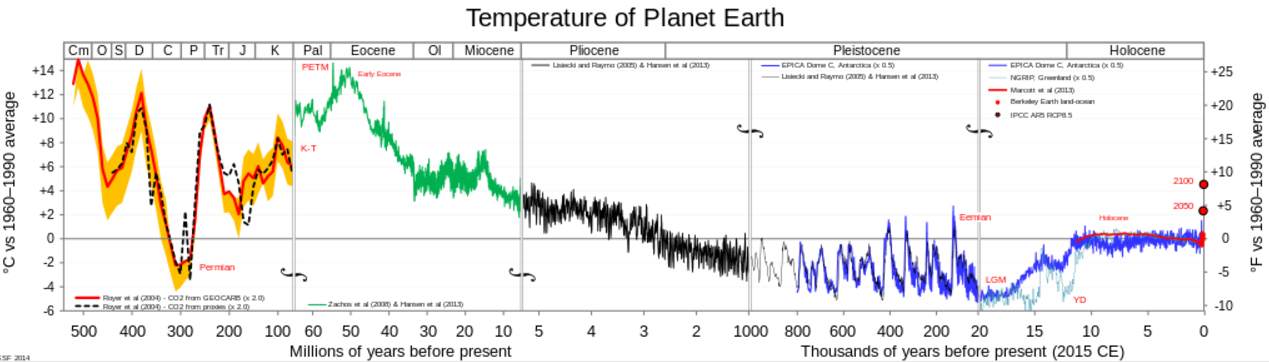
Earth mean temperature       = 288   Kelvin
Current rate of increase     =   1.7 Kelvin/century
Temperature in 1800          =   -.9 Kelvin compared to present
Temperature in 1000          =   -.5 Kelvin compared to present
 |
 |
|---|---|
 |
 |
|---|---|
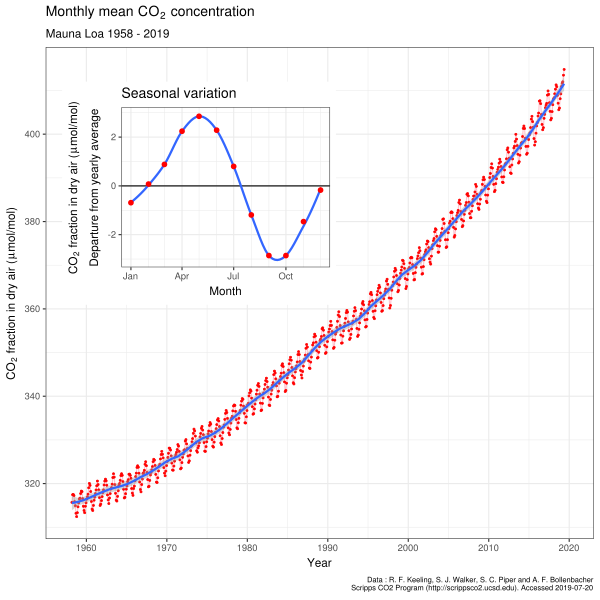
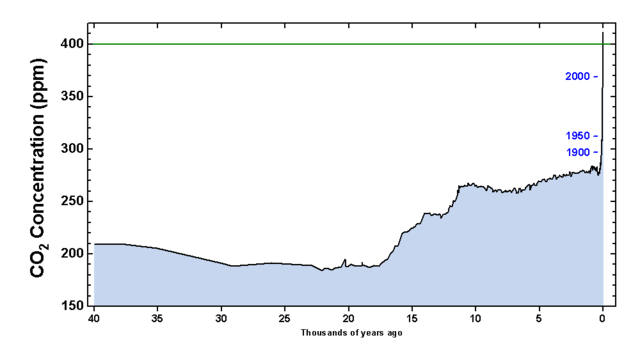
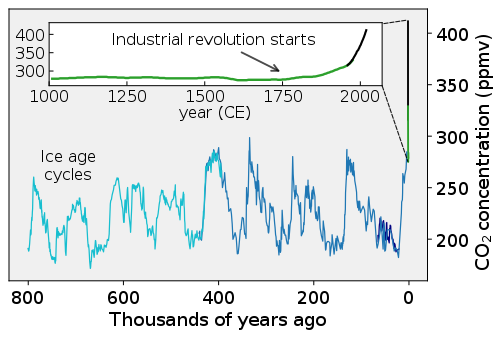
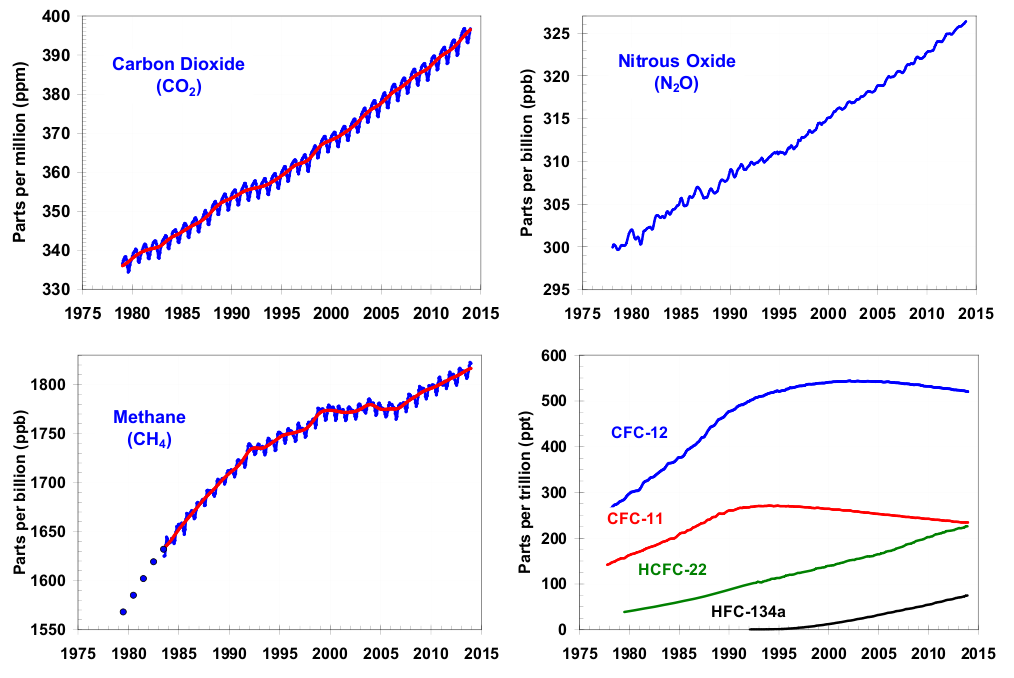
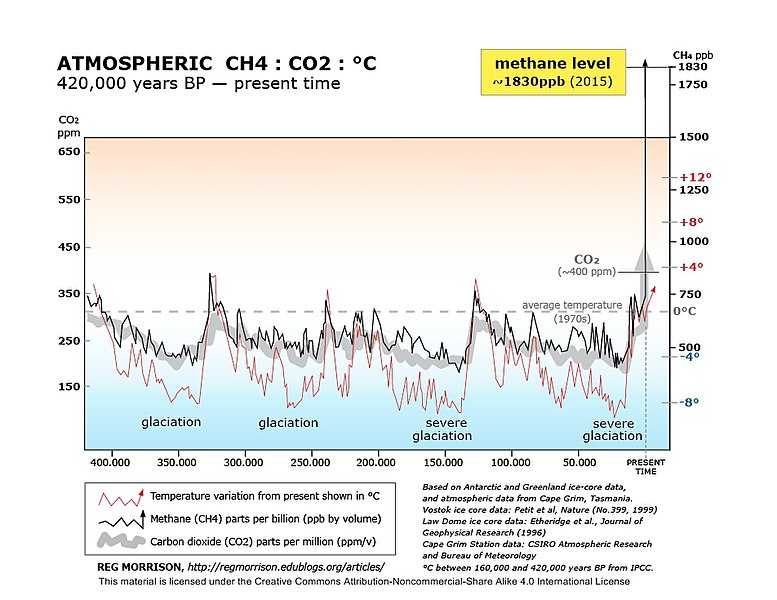
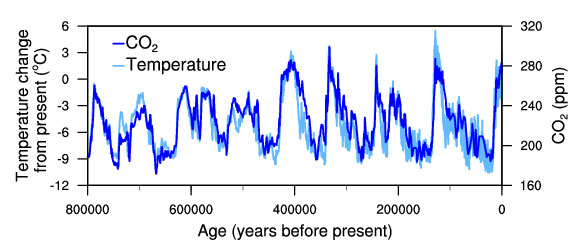
Atmosphere CO2 fraction    =  .00041
CO2 fraction in 1700       =  .00027
CO2 fraction last ice age  =  .00018             (1 million years ago)
CO2 fraction increase rate =  .000002 per year
Atmospheric carbon         =880000⋅109 kg       = 121000   tons/person
 |
 |
|---|---|
 |
 |
|---|---|
 |
|---|
|
|---|
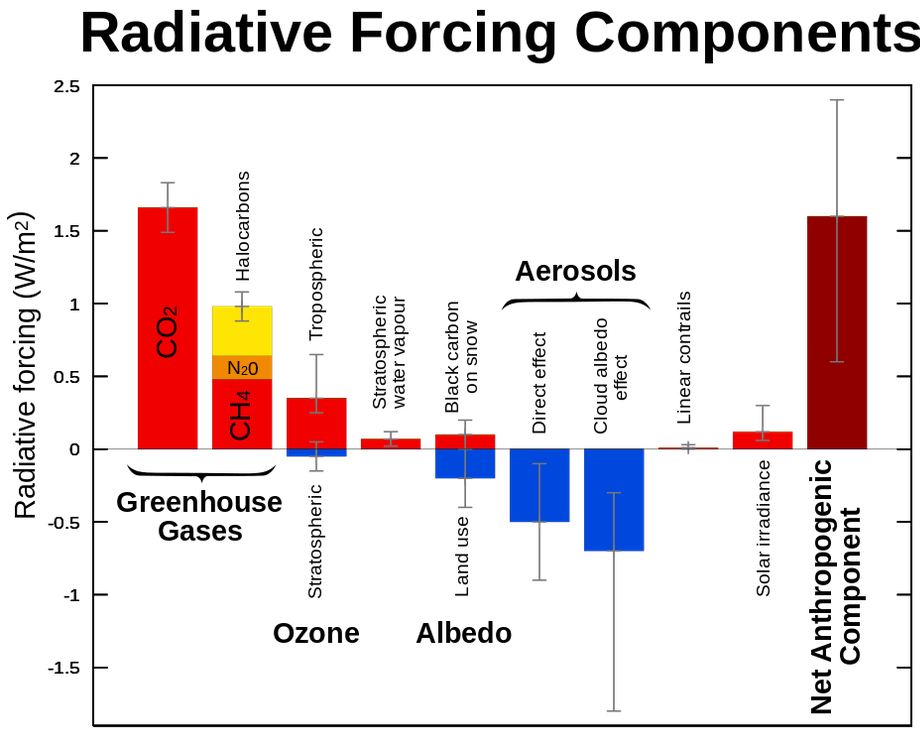
Gas        Year      Year     Contribution  Radiation  Half life
           1750      2015     to warming     change     (years)
           (ppm)     (ppm)                  (Watts/m2)
H2O                             36-72%
CO2       280       395          9-26%        1.88        60
CH4          .7       1.79       4-9%          .49        12
O3           .237      .337      3-7%          .4           .05
N2O          .270      .325                    .17       114
CCl2F2       0         .000527                 .169      100
CCl3F        0         .000235                 .061       60
CHClF2       0         .00022                  .046       12
"ppm" stands for parts per million.
 |
 |
|---|---|
 |
|---|
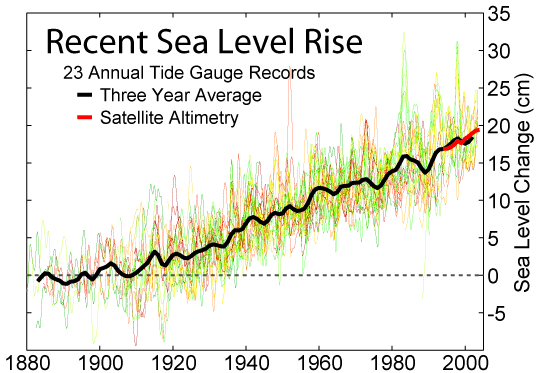
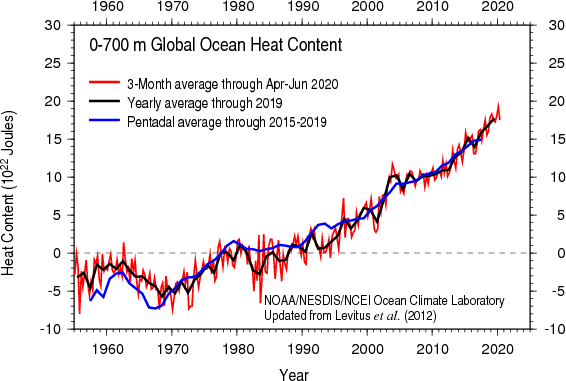
Sea level rise since 1870          =   225 mm
Sea level rise if Greenland melts  =  7200 mm
Sea level rise if Antarctica melts = 61100 mm

Total rate of sea level rise       =  2.8 mm/year     3.3
Greenland melting rate             =   .6 mm/year      .049
Antarctica melting rate            =   .2 mm/year      .026
Glacier melting rate               =   .3 mm/year     1.2
Thermal expansion rate             =   .8 mm/year     1.4

Acceleration of sea level rise     = .013 mm/year/year
Ocean heat gain                    =    5 ZJoules/year
Water:
             Volume     Change
              kkm3      km3/yr

Ocean           1338000      1200
Groundwater       23400
Ground ice          300
Lake                176.4
Mountains            40.6
Atmosphere           12.9
Swamp                11.5
River                 2.12
Biomass               1.12

Ice, Antarctica   21600      -191
Ice, Greenland     2340      -247
Ice, Canada islands  83.5     -60
Ice, Alaska          44.6     -50
Ice, Russia, NE      33.8      -2
Ice, Himalayas       23.7     -26
Ice, Svalbard        13.3      -5
Ice, Andes, South    11.7     -29
Ice, Iceland          8.7     -10
Ice, Canada, West     2.6     -14
Ice, Scandinavia       .8      -2
Ice, Swiss Alps        .3      -2
Ice, New Zealand       .3       0
Ice, Caucuses          .2      -1
Ice, Russian islands          -11
Ice, Andes, North              -4
 |
|---|
 |
.png) |
|---|---|
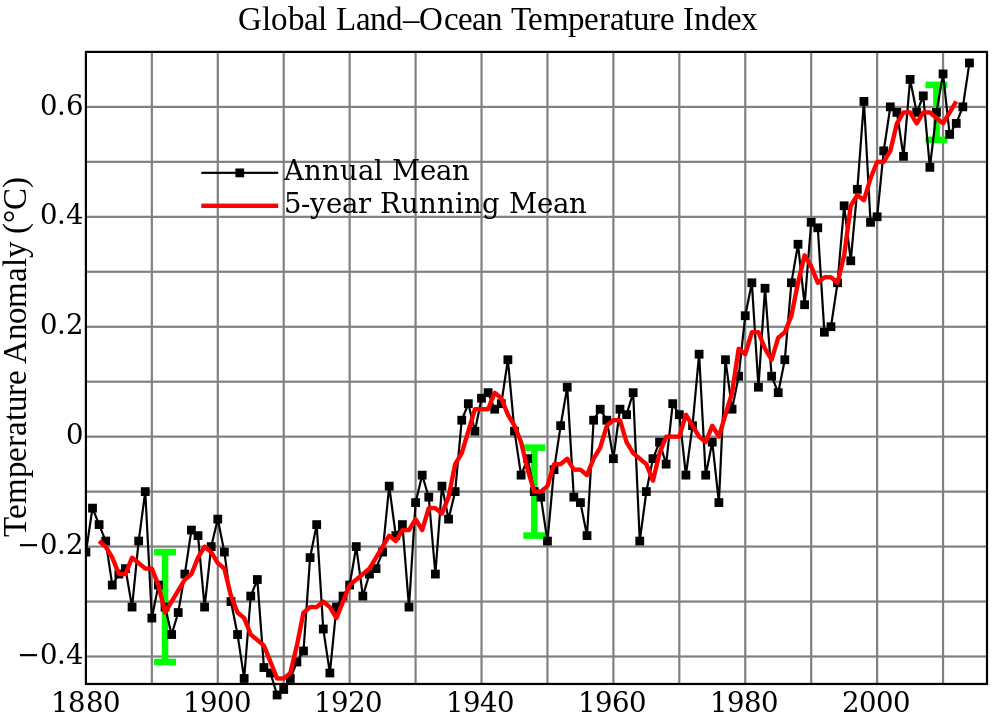
Atmosphere temperature rise=   .017 Kelvin/year      (.9 Kelvin since 1800)
Sea level rise             =  2.8   mm/year          (225 mm since 1800)
Atmosphere CO2 frac        =   .0035                 (.0027 in 1800)
Atmosphere carbon          =720     Gtons
Photosynthesis of carbon   =120     Gtons/year
Human carbon emissions     =  9     Gtons/year   = 1240   kg/person/year
Energy produced            =   .57  ZJoules/year =   78.6 GJ/person/year = 2490 Watts/person
Electricity produced       =   .067 ZJoules/year =    9.2 GJ/person/year =  292 Watts/person
Food                       =   .027 ZJoules/year =    3.7 GJ/person/year =  117 Watts/person  =  2500 Cal/person/day
Sunlight energy            =3850    ZJoules/year
Wind energy                =  2.25  ZJoules/year
Photosynthesis of biomass  =  3.00  ZJoules/year
Ocean heat gain            =  7.5   ZJoules/year
World power                = 18     TWatts       = 4500   Watts/person
Energy cost                = 16     T$/year      = 2210   $/person/year   (27.8 $/GJoule)
Population                 =  7.254 billion
Food                       =  1.58  Tkg/year     =  218   kg/person/year  (As carbs)
Earth land area            =148.9   Mkm2         =    2.0 Hectares/person
Rainfall over land         =107000  km3/year     =14800   tons/person/year
River flow                 = 37300  km3/year     = 5140   tons/person/year
Water total use            =  9700  km3/year     = 1390   tons/person/year
Water for agriculture      =  1526  km3/year     =  218   tons/person/year
Water for home use         =   776  km3/year     =  111   tons/person/year
Water desalinated          =    36  km3/year     =    5   tons/person/year
Rainfall increase per year =   .20  mm/year          (Rainfall is increasing with time)
The above table can be used to convert various quantities, such as:
Energy of hydrocarbon food                      17  MJoules/kg
Agricultural water required to produce food   1000  litres/kg       (in the form of carbohydrates)
Electricity cost                               100  $/MWh           =  2.78⋅10-8 $/Joule
Agricultural water required to produce food   1000  litres/kg       (in the form of carbohydrates)
World average                               722000  people per kg3 of water used
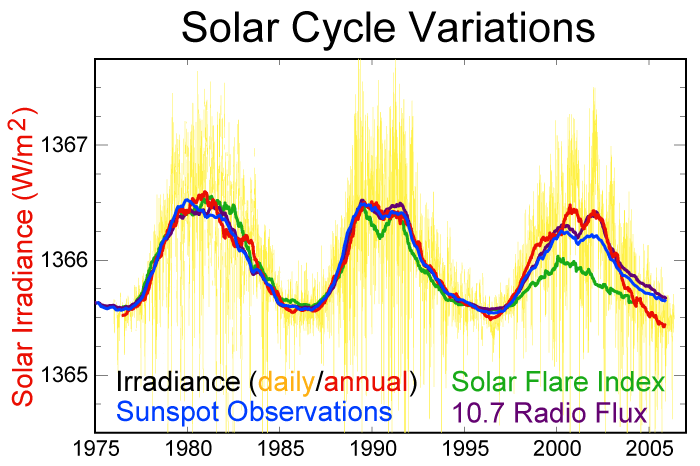
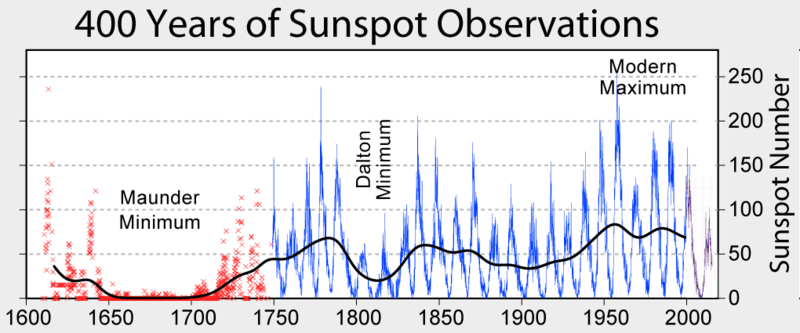
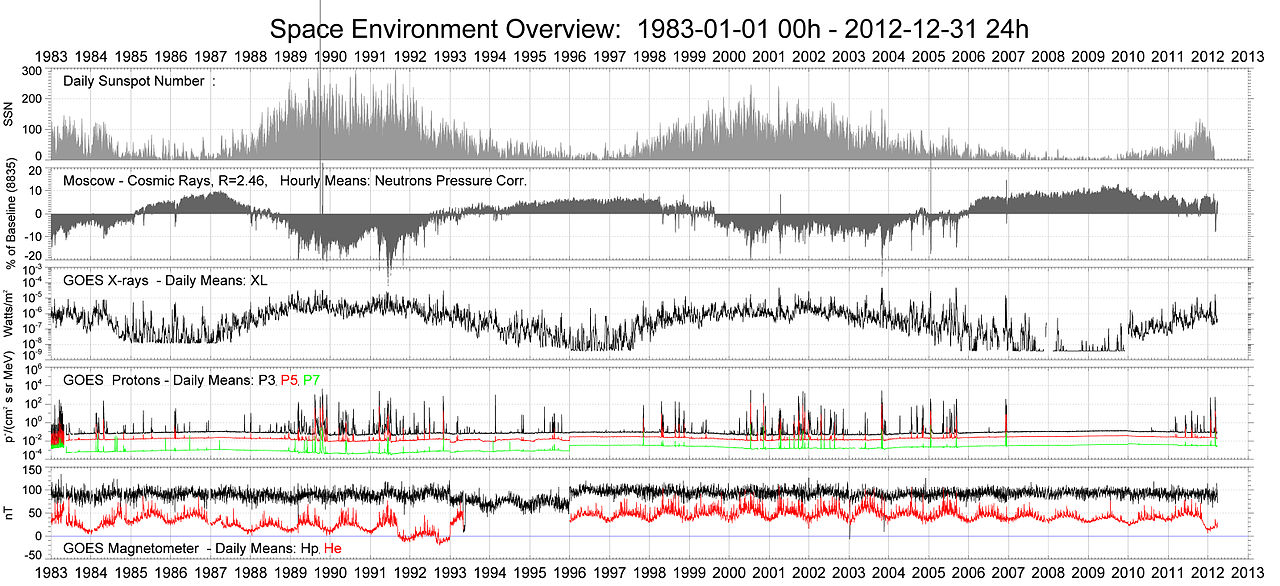
Sunspot number correlates with solar intensity.
 |
 |
|---|---|
Solar intensity has long-term variations and these impact climate. The sun is presently dimming.
 |
|---|
 |
|---|
 |
 |
|---|---|
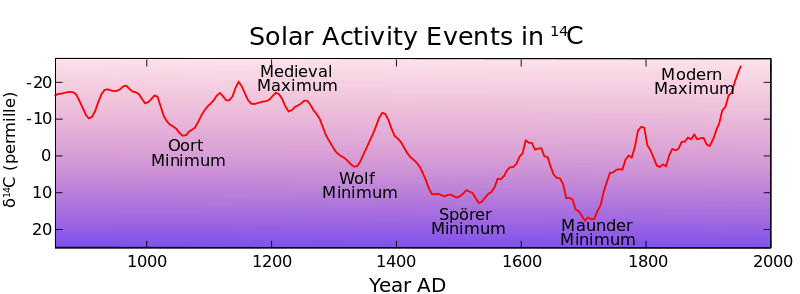
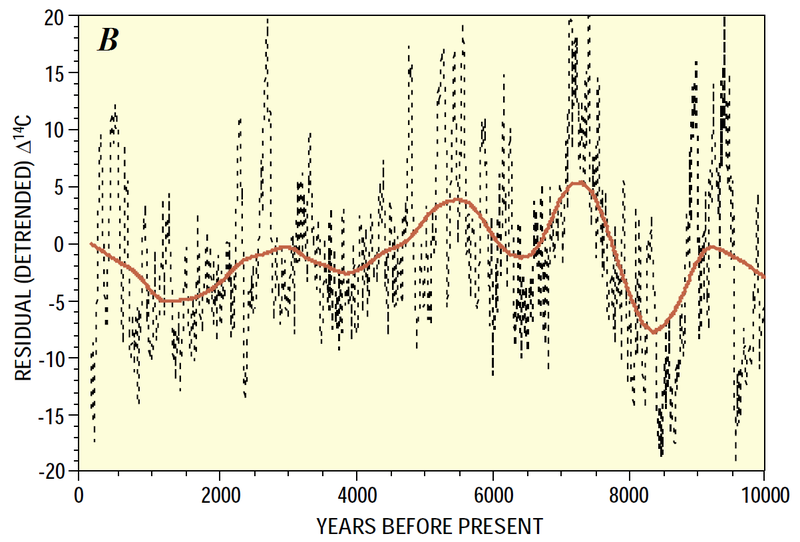
Carbon-14 is a proxy for solar intensity.
Sunspots impact cosmic rays, and cosmic rays have an impact on climate by forming clouds.
Sun intensity average             =  1366.0 Watts/meter2
Sun intensity at sunspot maximum  =  1367.0 Watts/meter2
Sun intensity at sunspot minimum  =  1365.1 Watts/meter2
 |
|---|
The elements most easily estracted from seawater are potassium and lithium. Magnesium is somewhat harder, and uranium is much harder.
"Profitability" is mass fraction times element value. The metals in seawater are:
      Mass fraction   Element   Profitability
           ppt         $/kg     (Potassium=1)

Sodium     10.8            3       N/A
Rubidium     .000125   15500       3.84
Potassium    .380          2.9     1
Barium       .0003       550        .53
Magnesium    .129          2.5      .18
Strontium    .013          5.3      .14
Caesium      .0000003  61800        .057
Lithium      .000183      70        .0021
Uranium      .000003     101        .0017
Beryllium    .0000004    150        .00013
If elements are extracted by electrolysis, then the relative profitabity is:
Concentration       = C        Parts per thousand
Element value       = V        $/kg
Element atomic mass = M        Atomic mass units
Profitability       = P = CVM
 |
 |
|---|---|
California population    = 39.1  million people
California area          =424    thousand km2
California rainfall      =   .56 meters                 Averaged over state
Sacramento River         = 25.1  km3/year
Klamath River            = 15.3  km3/year
Eel River                =  9.5  km3/year
San Joaquin River        =  4.6  km3/year
Smith River              =  3.34 km3/year
Russian River            =  2.02 km3/year
Mad River                =  1.39 km3/year
Navarro River            =   .44 km3/year
Santa Ana River          =   .41 km3/year
Salinas River            =   .38 km3/year
California river total   = 87    km3/year
California rainfall      =237    km3/year
Water from Colorado Riv. =   .51 km3/year    Water from outside the state
Groundwater overdraft    = 15    km3/year    Groundwater not replaced
Water total use          =108    km3/year    Households and agricultural
Water for agricultural   = 41.9  km3/year
Water for households     = 10.9  km3/year
Water flowing thru delta = 20.3  km3/year    Water flowing into SF Bay
Water exported from delta= 13.3  km3/year    San Francisco Bay Delta
Aqueduct: Central Valley =  8.9  km3/year    Central Valley Project
Aqueduct: State Water    =  3.5  km3/year    State Water Project
Aqueduct: Los Angeles    =   .49 km3/year
Aqueduct: Mokelumne      =   .45 km3/year
Aqueduct: Hetch Hetchy   =   .33 km3/year
Aqueduct: North Bay      =   .05 km3/year
Household total water use=504    m3/house/year
Household indoor use     =237    m3/house/year
Household landscaping use=267    m3/house/year
 |
 |
|---|---|
 |
 |
|---|---|
 |
 |
|---|---|
Ave Max Height Vol Area Year
(GW) (GW) (m) (km^3) (km^2) completed
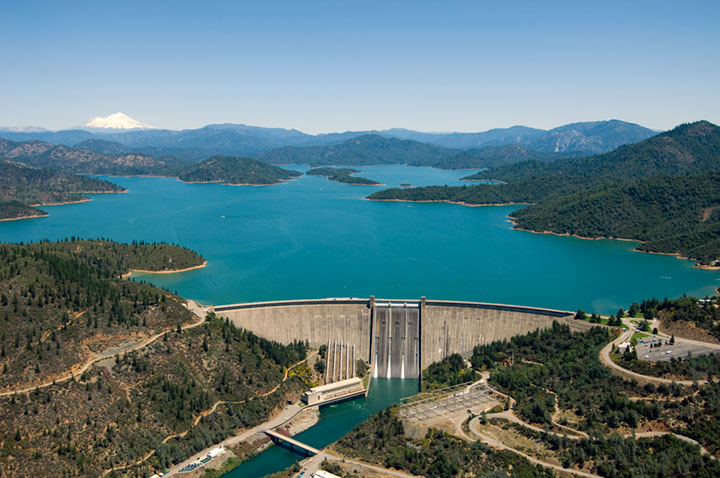
Shasta Dam .206 .676 100 5.6 120 1945
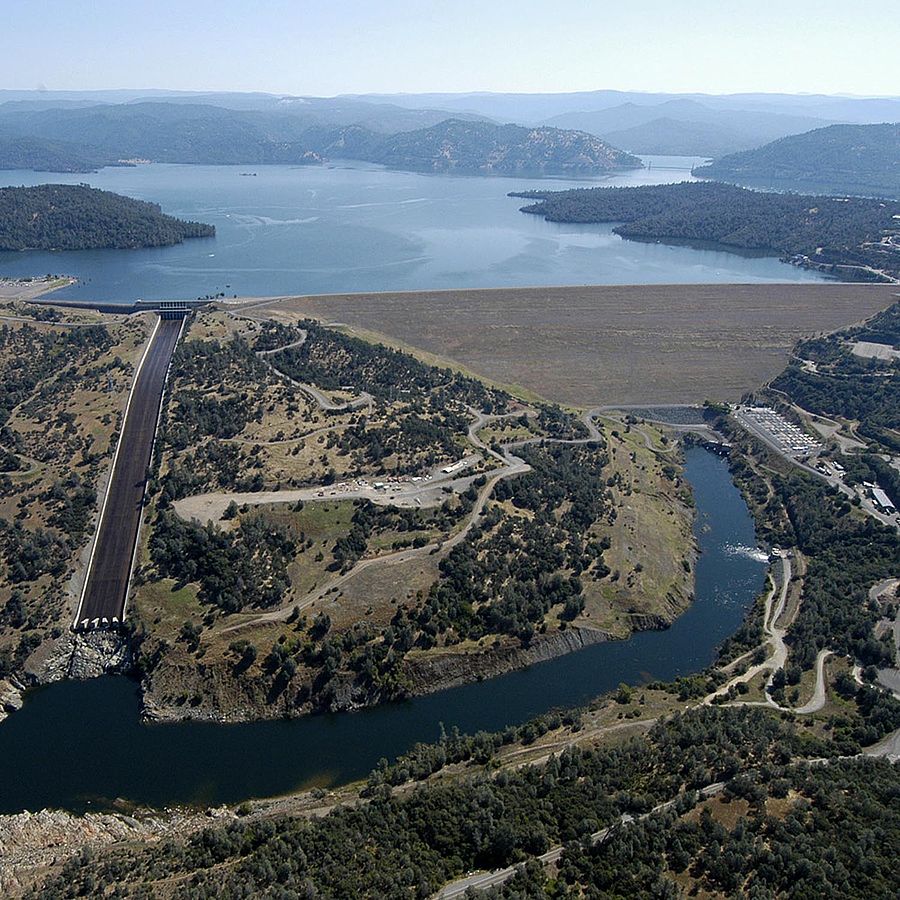
Oroville Dam .170 .819 187 4.4 64 1968
New Bullards .150 .340 398 1.2 20 1969
Folsom Dam .079 .199 91 1.4 48 1956
New Don Pedro .071 .203 170 2.5 52 1971
Parker Dam .052 .120 .8 78 1938
Pine Flat Dam .048 .165 129 1.2 24 1954
Trinity Dam .041 .140 130 3.0 72 1962
New Melones .037 .300 150 3.0 51 1979
New Exchequer .036 .094 133 1.3 29 1967
Canyon Dam .018 .041 109 1.6 114 1927
Monticello .007 .012 2.0 84 1957
San Luis Dam .424 2.5 51 1967
Oroville dam height         =  235 meters             Tallest dam in the USA
Lake Oroville lake volume   = 4.36 km3
Lake Oroville lake area     =   63 km2
Lake Oroville catchment area=10200 km2     Area of land that drains into Lake Oroville
 |
|---|
Drainage basin         = 6.4e5 km2
Farmland supported     = 14000 km2
Flow rate              =   637 m3/s       (Very little makes it to the ocean)
Hoover dam salt flow   =   9e6 tons salt/year
Total river flow       = 20.3  km3/year
Upper basin allotment  =  9.22 km3/year   (Utah, Wyoming, Colorado)
Lower basin allotment  =  9.22 km3/year   (California, Arizona, Nevada, New Mexico)
Mexico allotment       =  1.84 km3/year
California fraction    =  .267            (Fraction of river allotted to California)
Colorado fraction      =  .235
Arizona fraction       =  .170
Utah fraction          =  .104
Wyoming fraction       =  .064
New Mexico fraction    =  .051
Nevada fraction        =  .018
Mexico fraction        =  .091
Green River            =   171 m3/s       (Tributary)
Gunnison River         =    73 m3/s       (Tributary)
San Juan River         =    62 m3/s       (Tributary)
Dolores River          =    18 m3/s       (Tributary)
Little Colorado River  =    12 m3/s       (Tributary)
 |
 |
 |
|---|---|---|
Ave Max Height Vol Area Year
(GW) (GW) (m) (km^3) (km^2) completed
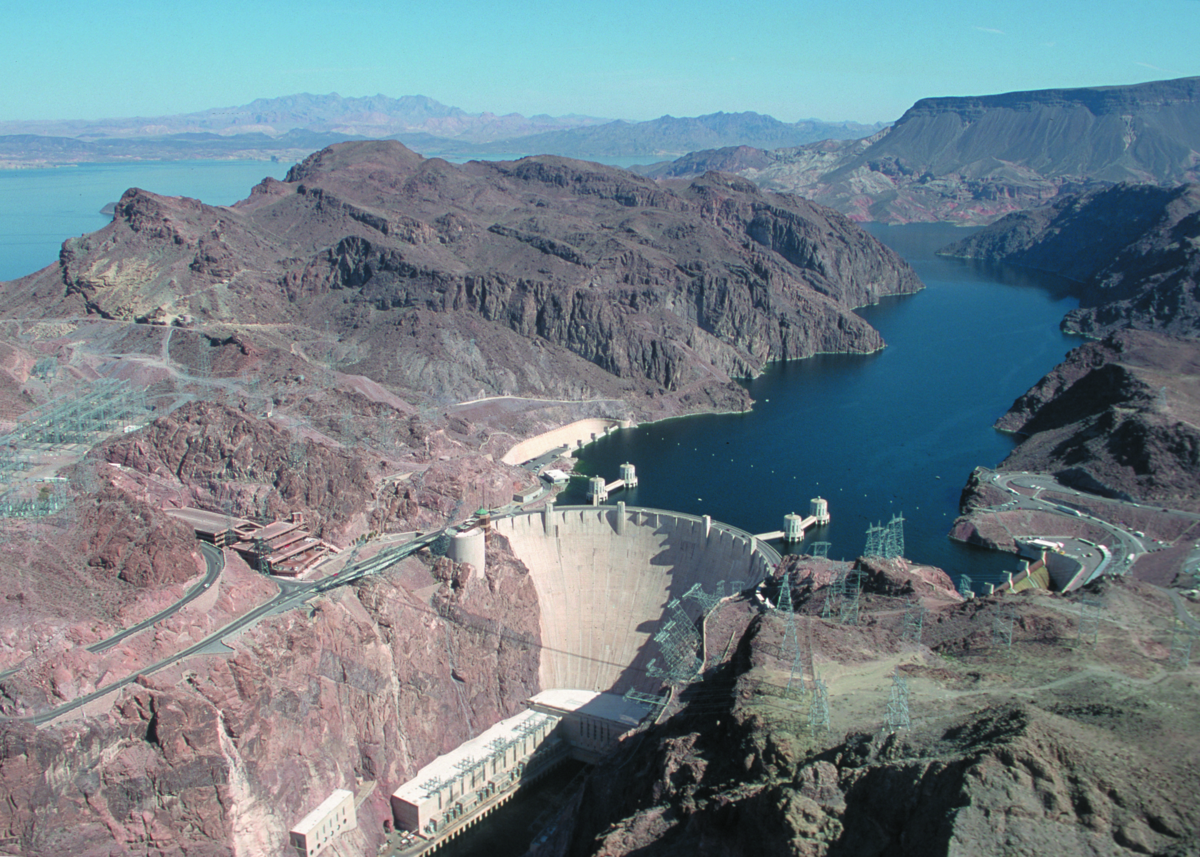
Hoover Dam .48 2.08 180 35.2 640 1936
Glen Canyon .40 1.30 160 32.3 653 1966
Davis Dam .131 .255 41 .2 107 1951
Parker Dam .052 .120 .8 78 1938
Flaming Gorge .039 .153 120 4.7 170 1964
Morrow Point .033 .173 126 .1 3 1968
Blue Mesa .023 .086 101 1.2 37 1966
Horse Mesa .015 .129 .3 11 1927
Navajo Dam .015 .032 116 2.1 63 1962
Ave: Average power generation in GWatts
Max: Max power capacity in GWatts
Height: Height of waterfall for power generation
Vol: Volume of reservoir
Area: Area of reservoir
California is the most water-stressed state in terms of tons of
rain per person.
          People    Land   People    Rain  Tons of
          (10^6)   (10^6    /Ha      (m)    rain
                    km^2)                  /person

World     7254    148.9     .49      .990   20.2
USA        321.4    9.53    .33      .715   21.7
Mexico     121.7    1.96    .61      .758   12.2
Montana      1.03  .381     .27      .390  144
Wyoming       .59  .253     .23      .328  141
Nebraska     1.90  .200     .95      .599   63.1
New Mexico   2.09  .315     .66      .371   56.0
Idaho        1.65  .216     .76      .481   54.7
Kansas       2.91  .213    1.37      .733   53.5
Oregon       4.03  .255    1.58      .695   44.0
Oklahoma     3.91  .181    2.16      .927   43.9
Iowa         3.12  .146    2.14      .864   40.4
Missouri     6.08  .181    3.36     1.071   31.9
Washington   7.17  .185    3.88      .976   25.2
Wisconsin    5.77  .170    3.39      .829   24.5
Nevada       2.89  .286    1.01      .241   23.9
Utah         3.00  .220    1.36      .310   22.8
Colorado     5.46  .270    2.02      .405   20.0
Texas       27.47  .696    3.95      .734   18.6
Arizona      6.83  .295    2.32      .345   14.9
California  39.14  .424    9.23      .563    6.1
 |
|---|
 |
|---|
 |
|---|
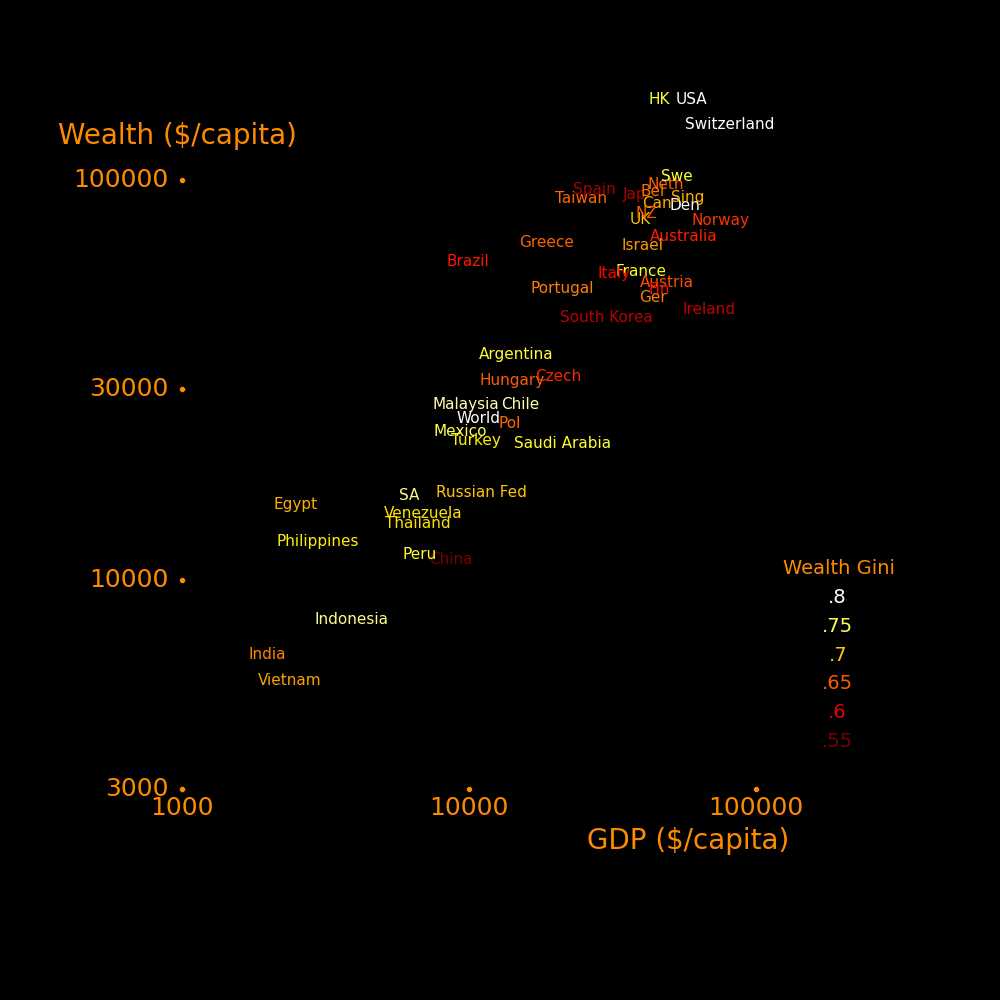
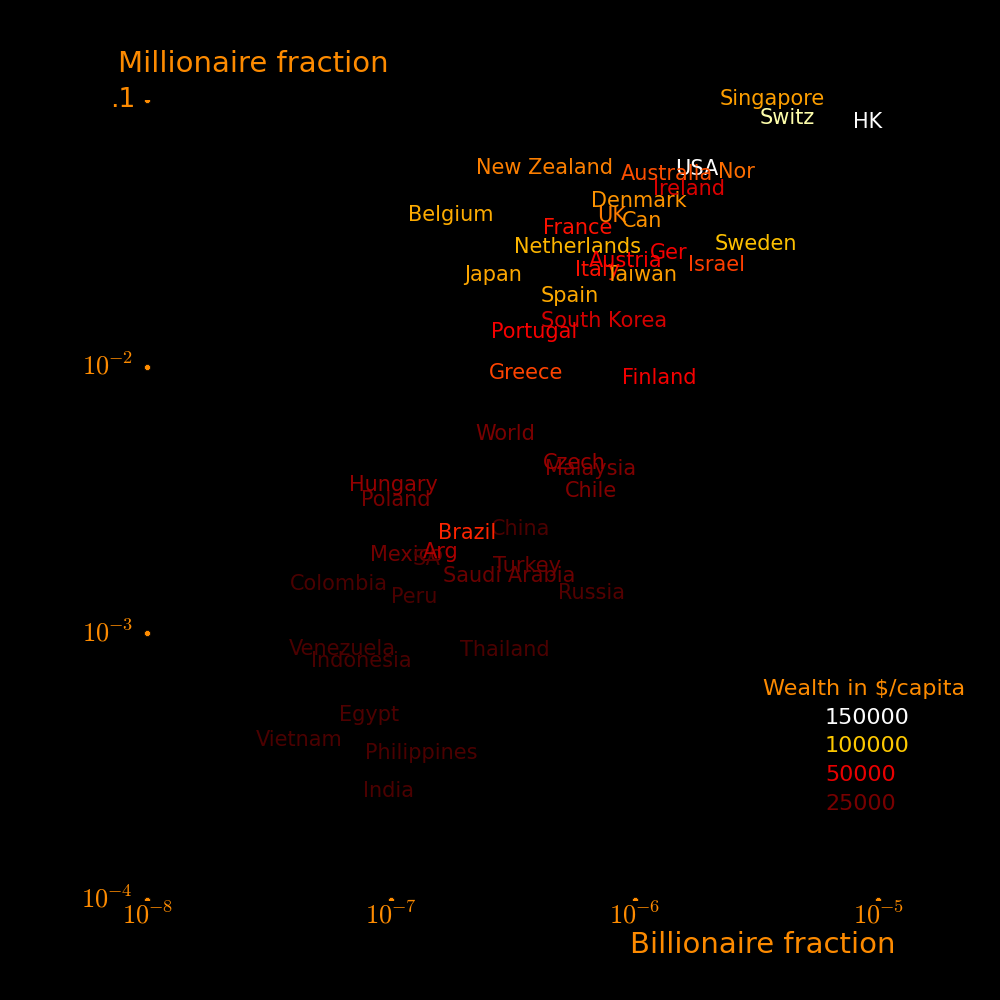
Nations to the upper right tend to have low wealth inequality and nations to the lower left tend to have high wealth inequality.
Ideally, a nation should have large wealth/capita, large GDP/capita, and small wealth Gini. The nations that stand out in this regard are Norway, Australia, and Japan.
 |
|---|
 |
|---|
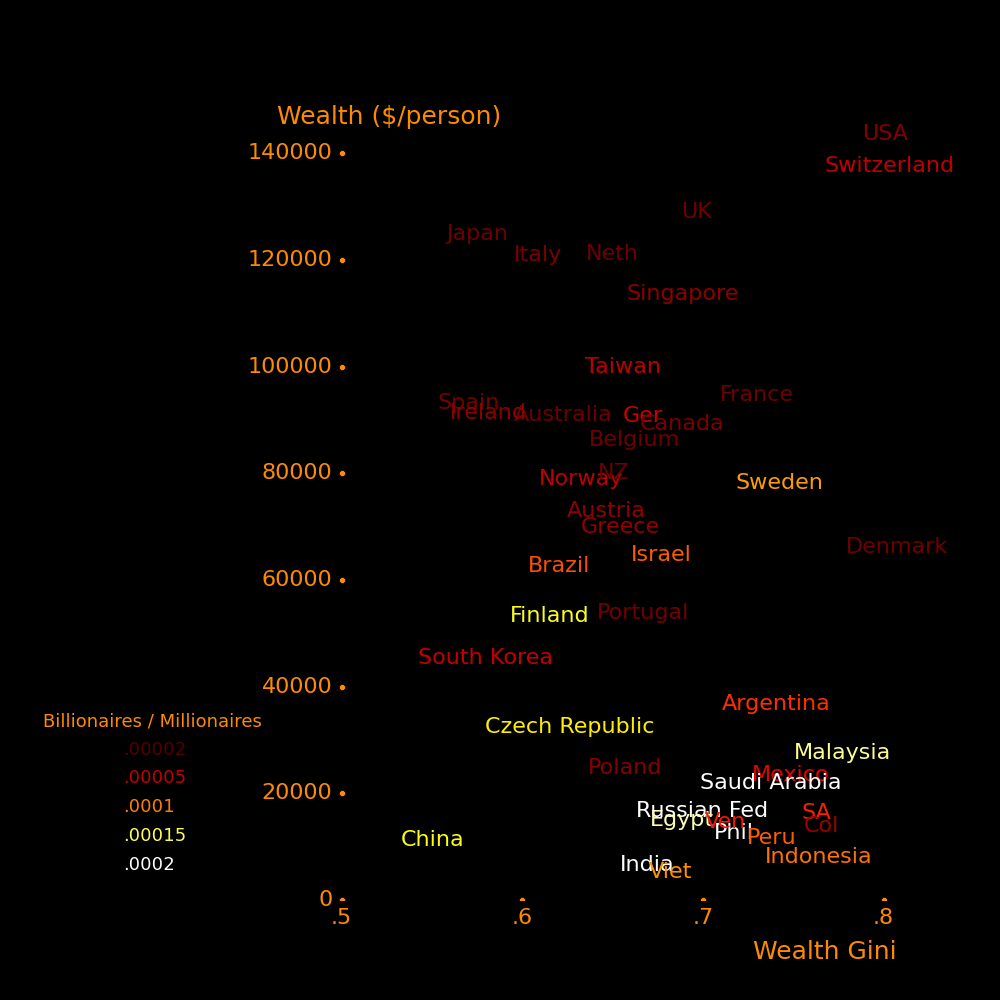
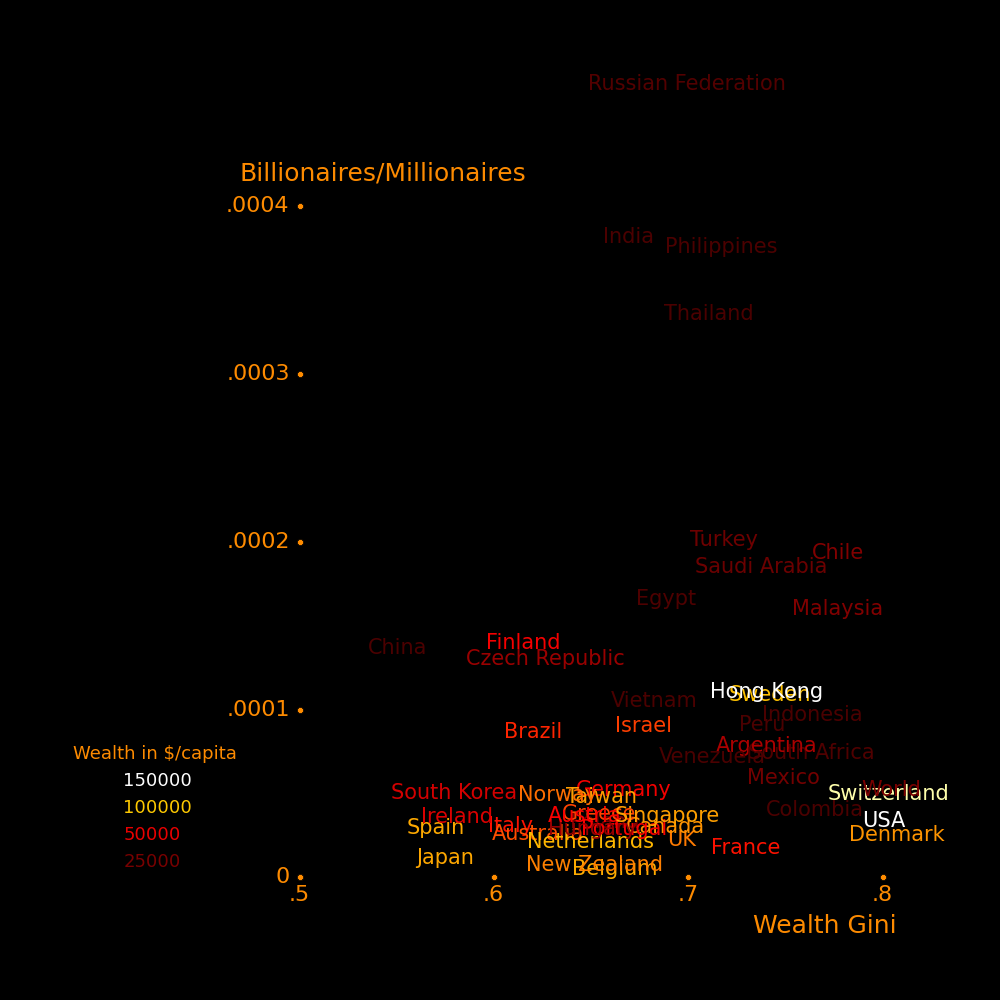
The wealth Gini is more sensitive to millionaires than billionaires. A nation can have a low wealth Gini and also be billionaire heavy.
 |
|---|
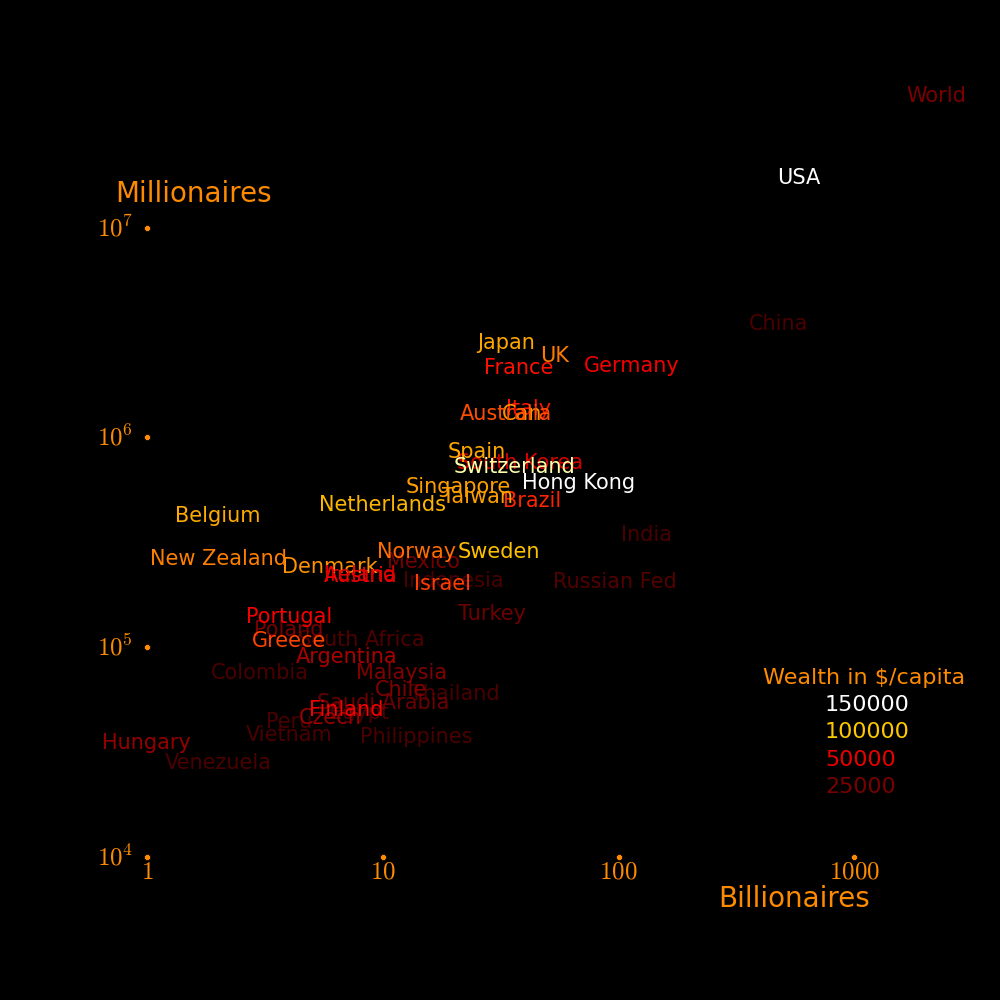
The world's undisputed economic superpower is the USA, in terms of wealth/capita, millionaires, and billionaires.
 |
|---|
 |
|---|
|
 |
|---|---|
 |
 |
|---|---|
 |
 |
|---|---|
 |
 |
|---|---|
 |
|---|
 |
|---|
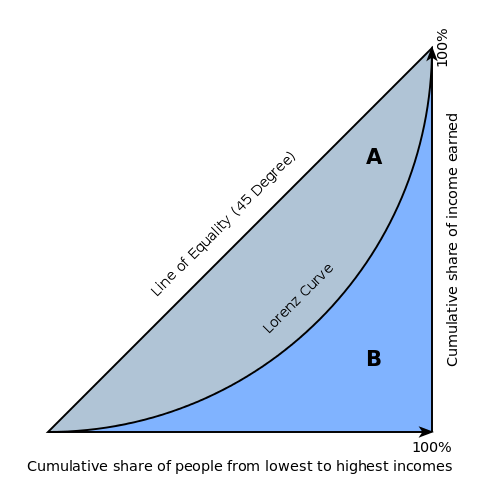
The Gini index characterizes the equality of a distribution. If everyone has the same wealth then the Gini index is 0 and if all the wealth is possessed by one person then the Gini index is 1.
In the above plot the Gini index is defined as
Area of the grey reagion  =  A
Area of the blue region   =  B
Gini index                =  G  =  A/(A+B)
 |
|---|
<0table width="100%">
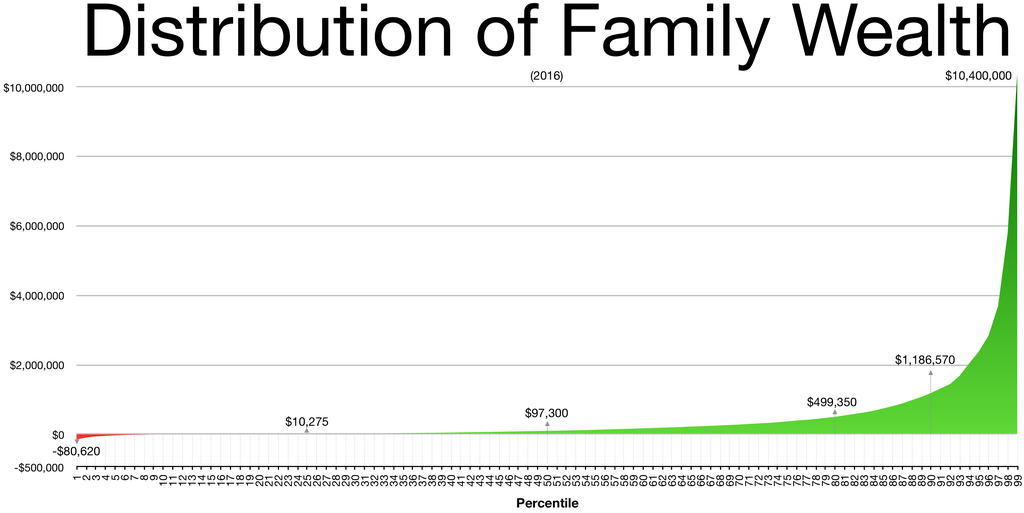
Percentile  Wealth   Fracion of total wealth
              M$

   1      10400000       .35
   2       7000000
   3       4500000
   4       2600000
   5       2200000       .62
  10       1187000       .73
  20        499000       .85
                 Billion $

Jeff Bezos          131       Amazon
Bill Gates           96       Microsoft
Warren Buffett       83       Berkshire Hathaway
Larry Ellison        62       Oracle
Mark Zuckerberg      62       Facebook
Larry Page           60       Alphabet
Charles Koch         50       Koch Industries
David Koch           50       Koch Industries
Sergey Brin          50       Alphabet
Michael Bloomberg    49       Bloomberg LP
Jim Walton           45       Walmart
S. Walton            44       Walmart
Alice Walton         44       Walmart
Steve Balmer         41       Microsoft, LA Clippers
Sheldon Adelson      35       Las Vegas Sands Corp
Rupert Murdoch      >10       Fox News
Michael Dell        >10       Dell
Elon Musk           >10       Tesla
Carl Icahn          >10
Charles Schwab      >10
George Lucas         >4
George Soros         >4
Steve Spielberg      >4
Gordon Moore         >4
Ross Perot           >4
Bob Kraft            >4
Tom Steyer
John Arnold
Donald Trump
Mark Cuban
California   165      Michigan     10    Missouri    6
New York     118      Pennsylvania 10    Virginia    5
Texas         56      Colorado     10
Florida       58      Tennessee    10
Massachusetts 17      Wyoming       9
Illinois      17      Wisconsin     9
Connecticut   17      Arizona       9
Georgia       13      New Jersey    8
Washington    12      Maryland      8
Nevada        11      Ohio          6
            Billion $

Apple          780
Alphabet       749
Microsoft      736
Amazon         728
Berkshire H.   450
Facebook       376
Johnson & J.   346
JPMorgan Chase 325
 |
|---|
 |
|---|
 |
 |
|---|---|
Trillion $
World wealth total 400
World stock markets 80
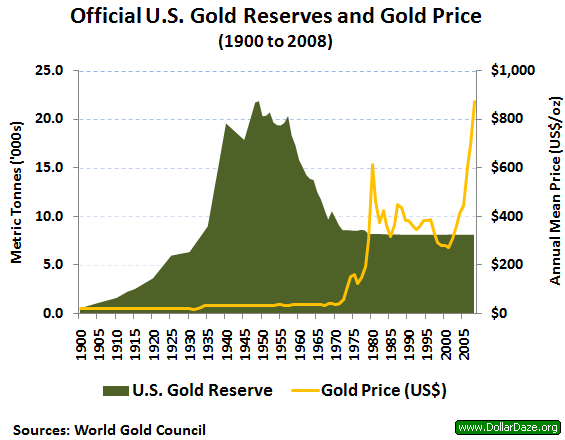
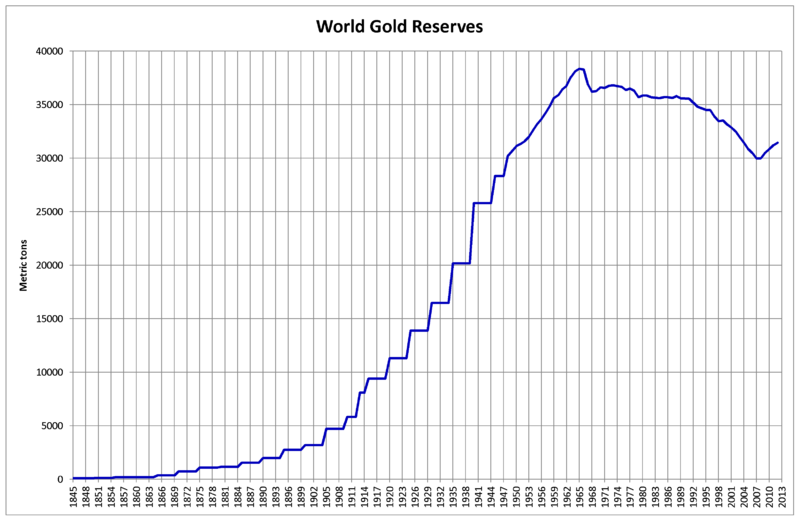
Gold, world reserves 10.9
World paper currencies 7
World cryptocurrencies 2.0
Silver, world reserves .01
Land
Buildings
Vehicles
Stock, New York 22.9
Stock, NASDAQ 10.9
Stock, Japan 5.7
Stock, London 4.6
Stock, Shanghai 4.0
Stock, Hong Kong 3.9
Stock, Euronext 3.9
Stock, Toronto 3.3
Stock, Shenzhen 2.5
Stock, Bombay 2.1
Stock, India National 2.0
Stock, Deutsche Borse 1.86
Stock, Switzerland 1.53
Stock, South Korea 1.46
Stock, NASDAQ Nordic 1.37
Stock, Australia 1.33
Stock, Taiwan .97
Stock, Brazil .94
Gold 10.9 60000 $/kg
Silver .044 .044 605 $/kg
Currency, USA 1.98
Currency, Europe 1.38
Currency, China 1.15
Currency, Japan 1.0
Currency, India .425
Currency, Russia .158
Currency, UK .104
Currency, Switz. .090
Currency, S. Korea .086
Cryptocurrency, Bitcoin 1.09
Cryptocurrency, Ethereum .210
Cryptocurrency, Binance .047
Cryptocurrency, Tether .041
Cryptocurrency, Cardano .038
Cryptocurrency, Polkadot .034
Cryptocurrency, XRP .025
 |
|
 |
|
 |
||
|---|---|---|---|---|---|---|
 |
 |
|
.png) |
|
|---|---|---|---|---|
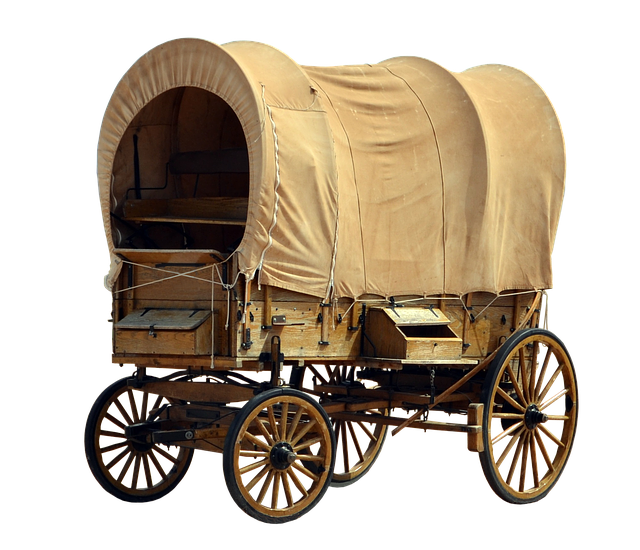
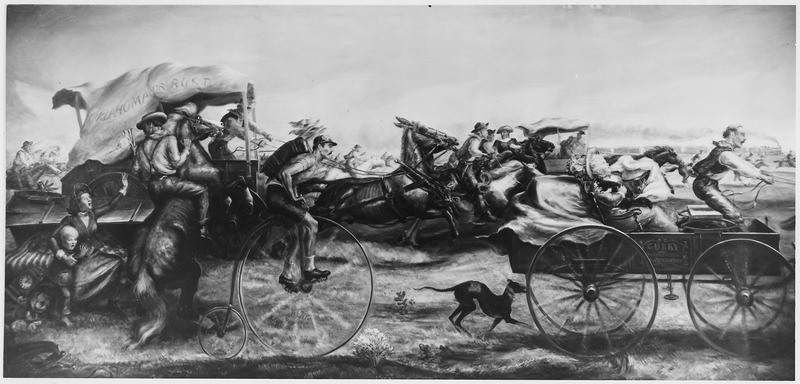
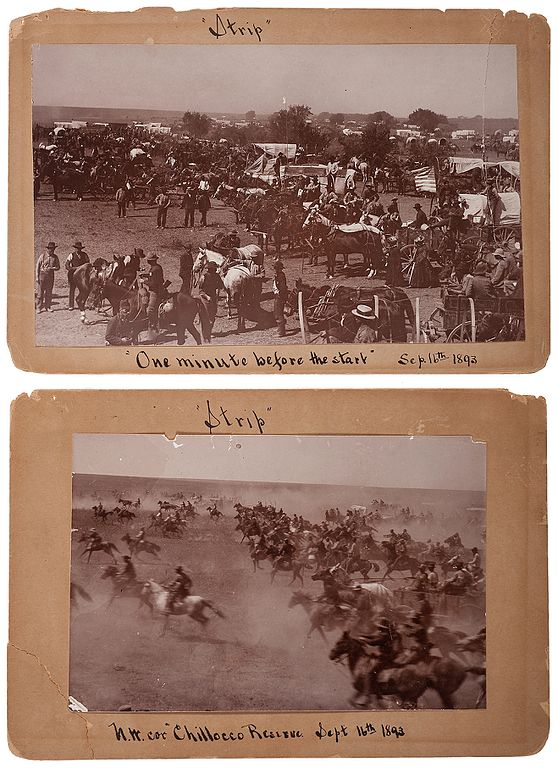
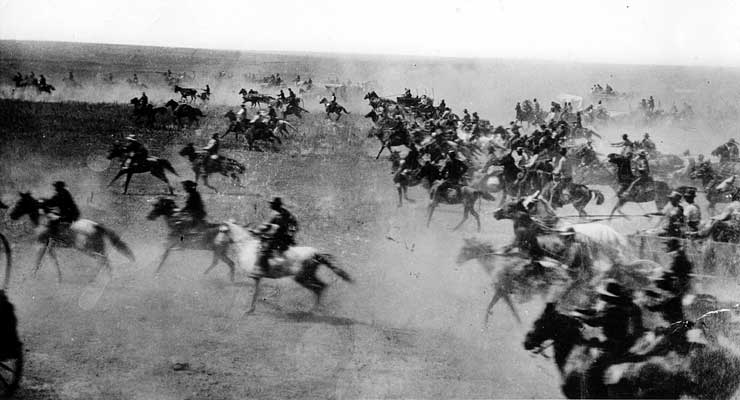
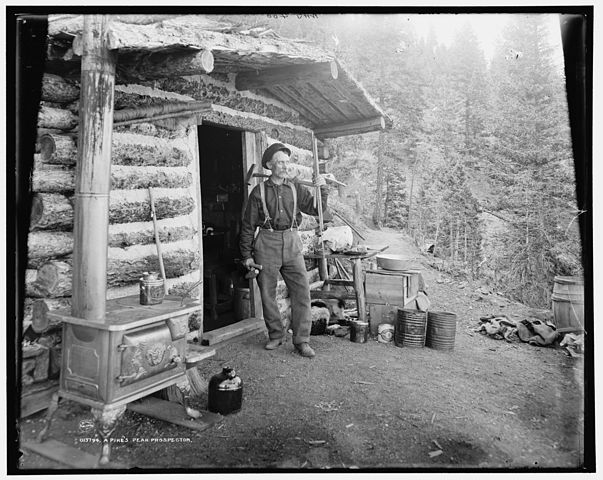
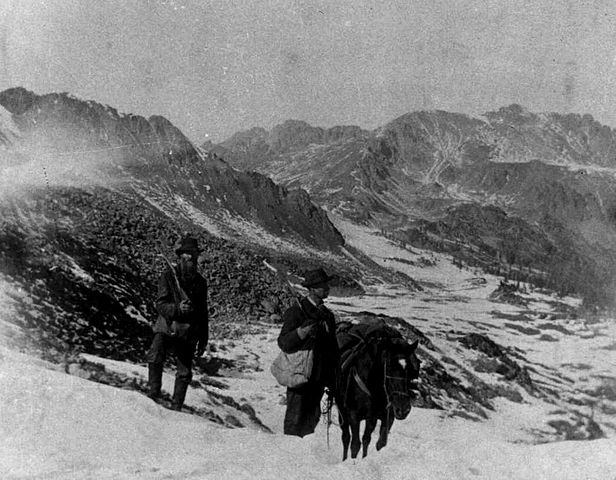
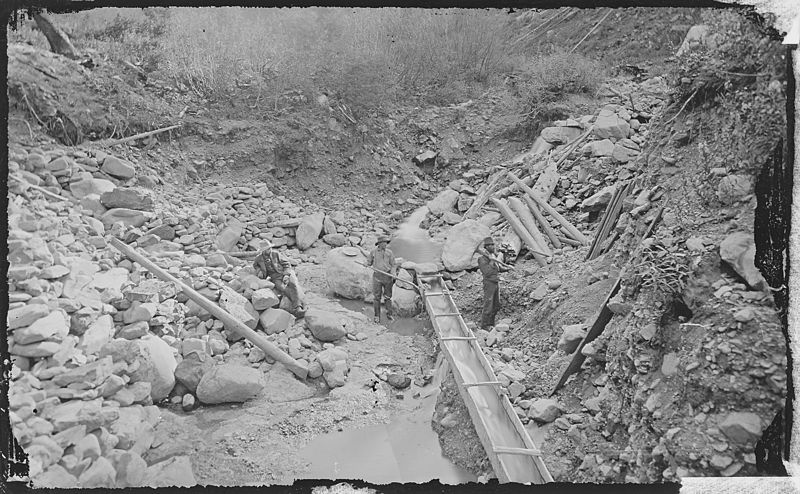
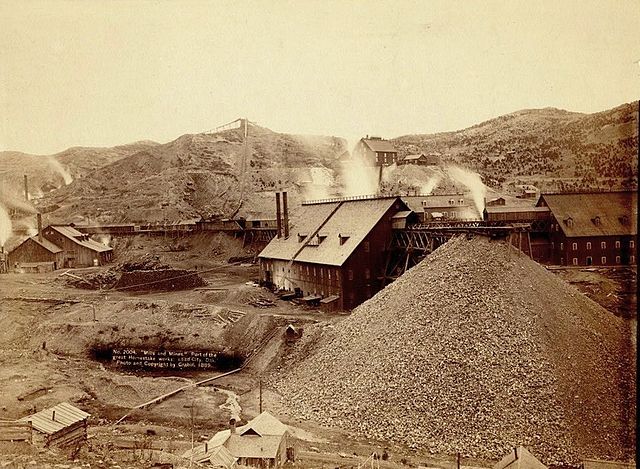
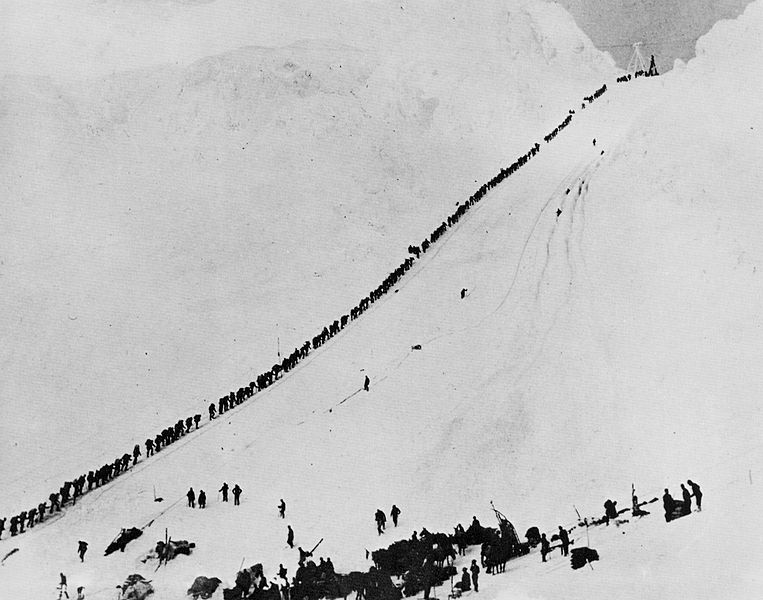
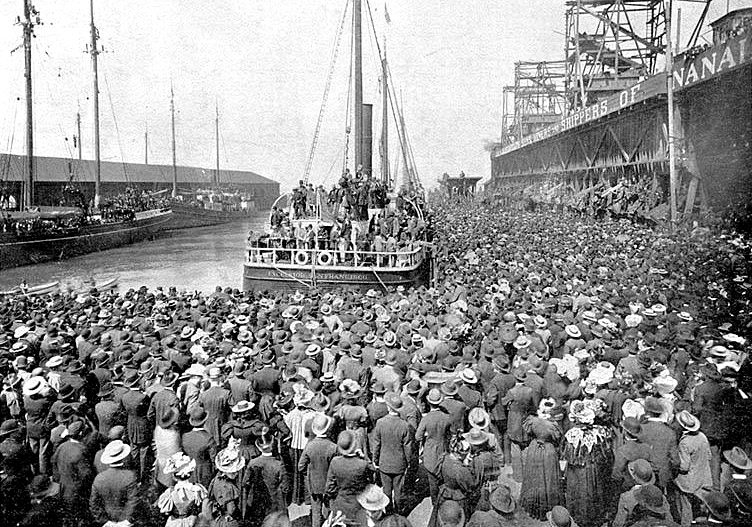
America has a rich history of frontiersmanship.
 |
 |
 |
|---|---|---|
       People   km2   Acres/homestead

1889   50000    8100       40
1991   20000              160
1992           14000
1993   40000   24240      160
 |
 |
 |
 |
 |
 |
 |
 |
|---|---|---|---|---|---|---|---|
 |
 |
 |
 |
|---|---|---|---|
The transcontinental railway was started in 1863 and completed in 1869, opening up the West to rail transport.
In 1828, rail crossed the Appalachian mountains.
By 1860 The North and Midwest constructed networks that linked every city. In the heavily settled Midwestern Corn Belt, over 80 percent of farms were within 8 km of a railway. The USA had 28900 railroad miles and the UK had 10400.
 |
 |
|---|---|
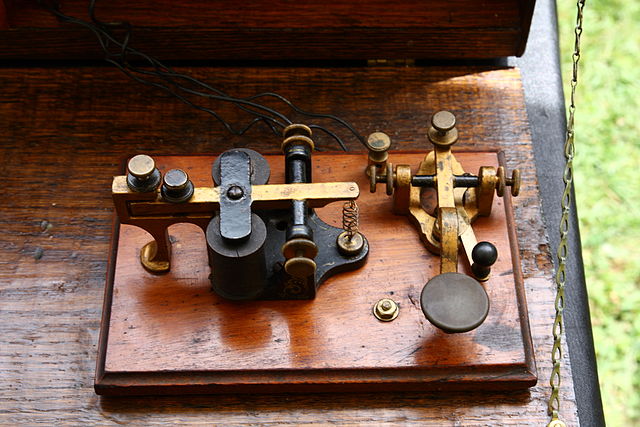
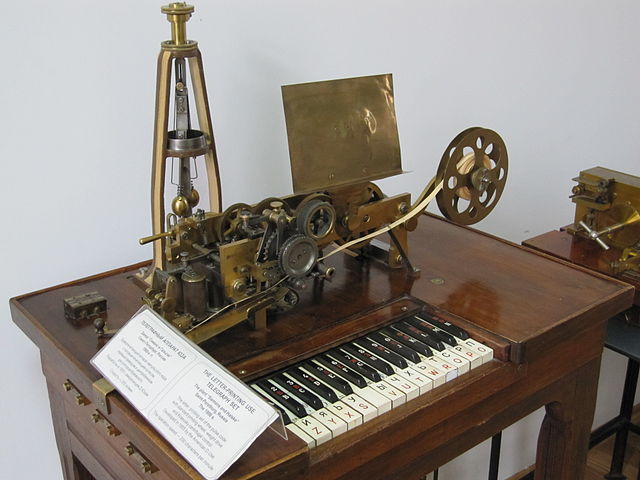
Telegraph km in 1852.
USA       37000
UK         2500
Prussia    2300
Austria    1600
Canada     1400
France     1100
 |
 |
|---|---|
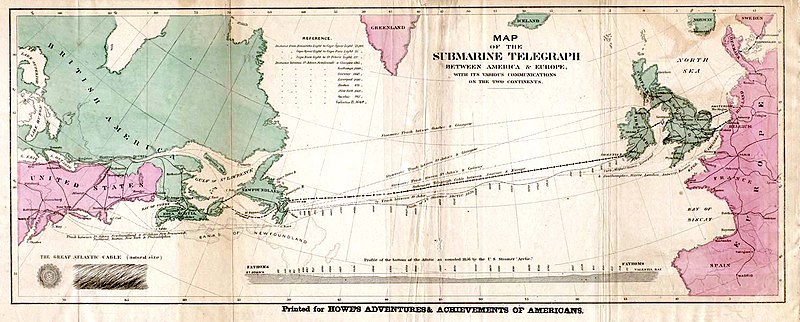
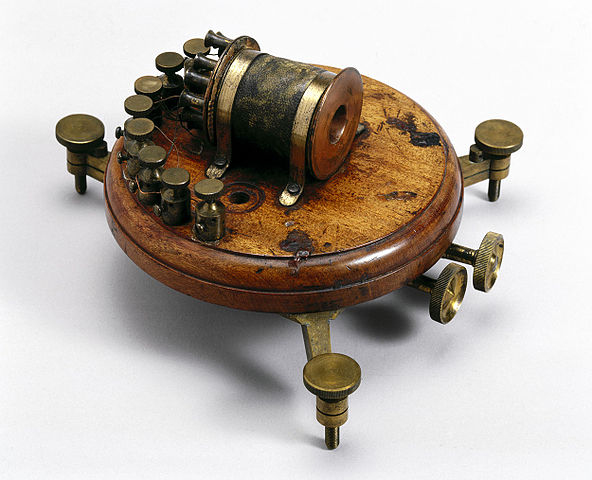
The first successful transatlantic cable linking America and the UK was completed in 1866. It was made possible by William Thompson's invention of the mirror galvanometer in 1857, for detecting telegraph signals.
 |
 |
_under_the_Verrazano_Narrows_Bridge.jpg) |
 |
|---|---|---|---|
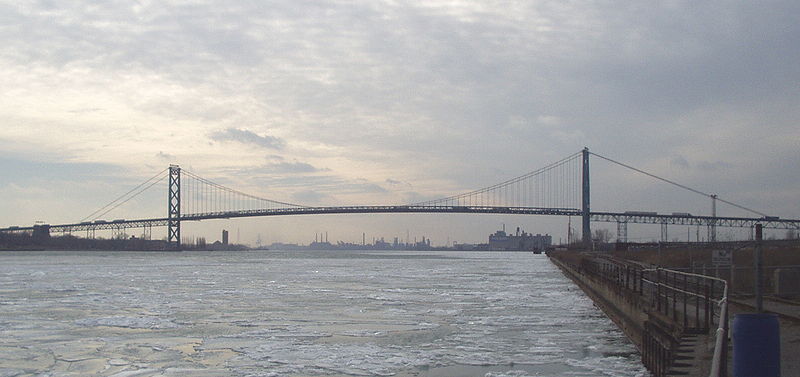
American suspension bridges have held the world record for length from 1849 to 1981.
In 1939 the world's 9 longest suspension bridges were American.
Year Length World record
Wheeling 1849 308 * West Virginia
Queenston-Lewiston 1851 317 * Niagara
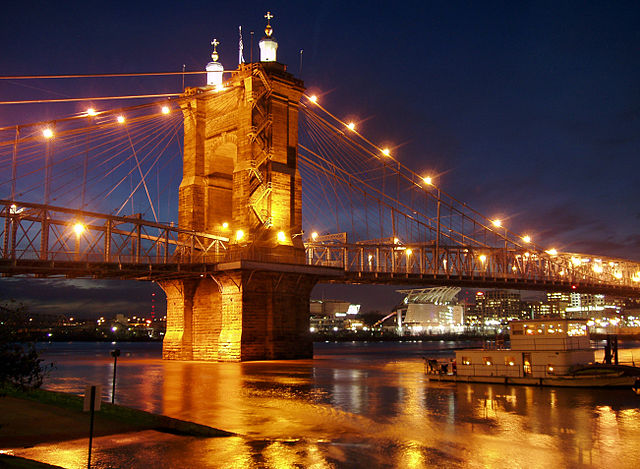
John A. Roebling 1866 322 * Kentucky, Ohio
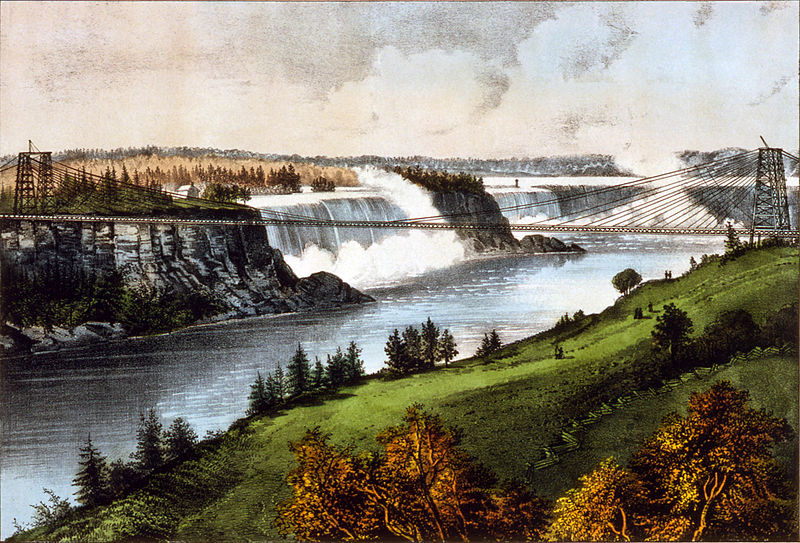
Niagara Clifton 1869 384 * Niagara
Brooklyn 1883 486 * New York City
Williamsburg 1903 488 * New York City
Bear Mountain 1924 497 * New York, Hudson River
Benjamin Franklin 1926 534 * Pennsylvania, New Jersey
Ambassador 1929 564 * Detroit, Ontario
George Washington 1931 1067 * New York City
Oakland Bay 1936 704 San Francisco Bay
Triborough Bridge 1936 421 Queens and Wards Island
Golden Gate 1937 1280 San Francisco Bay
Bronx-Whitestone 1939 701 New York City
Tacoma Narrows II 1950 853 New York City
Delaware Memorial 1951 656 Delaware River
Mackinac 1957 1158 Michigan, Upper and Lower Penninsula
Walt Whitman 1957 610 Delaware River
Throggs Neck 1961 549 New York City
Verrazano-Narrows 1964 1298 * New York City
|
 |
|
|---|---|---|
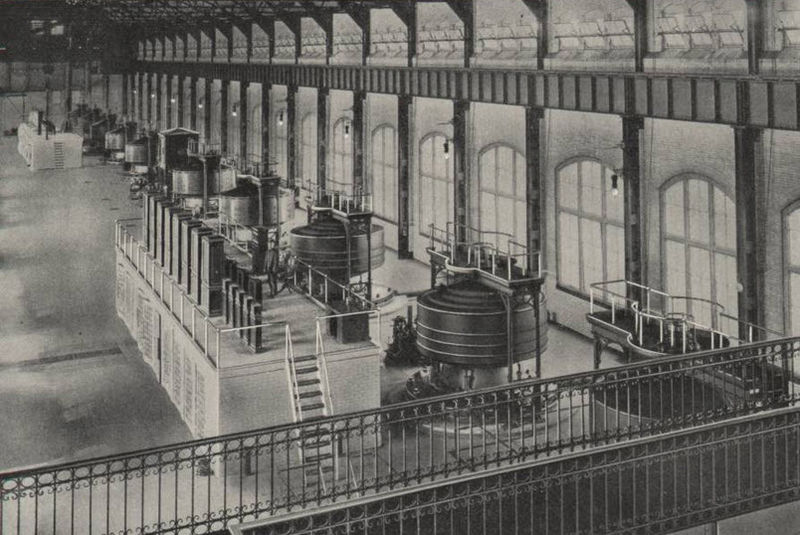
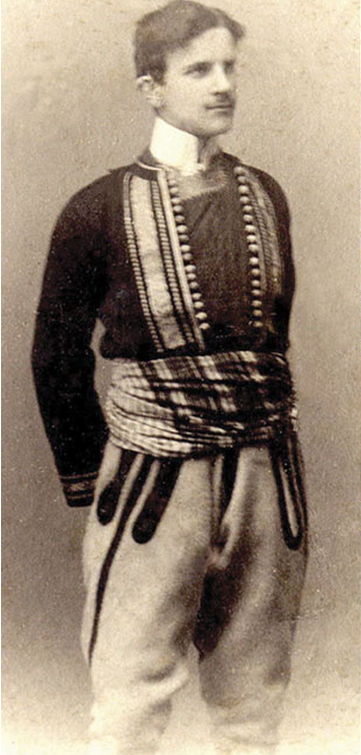
America was the first to harness large-scale hydroelectric power when Westinghouse and Tesla built a 37 MWatt plant at Niagara falls in 1895. They also solved the problem of long-distance transfer of electricity, inventing the alternating current method.
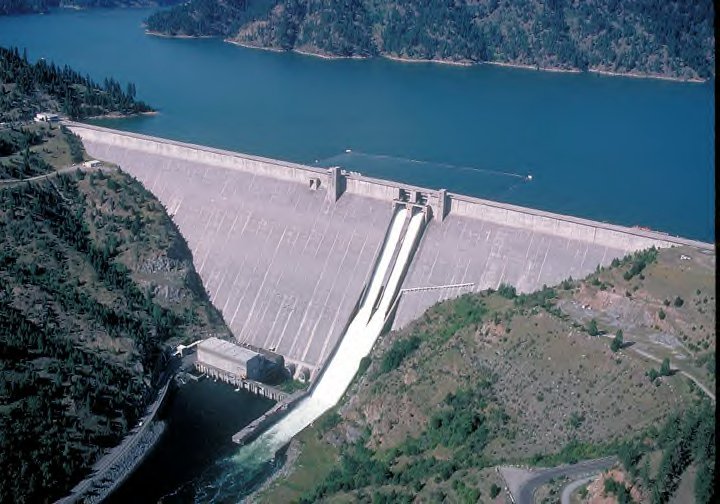
By 1930 America had built 10 dams with a height of at least 90 meters.
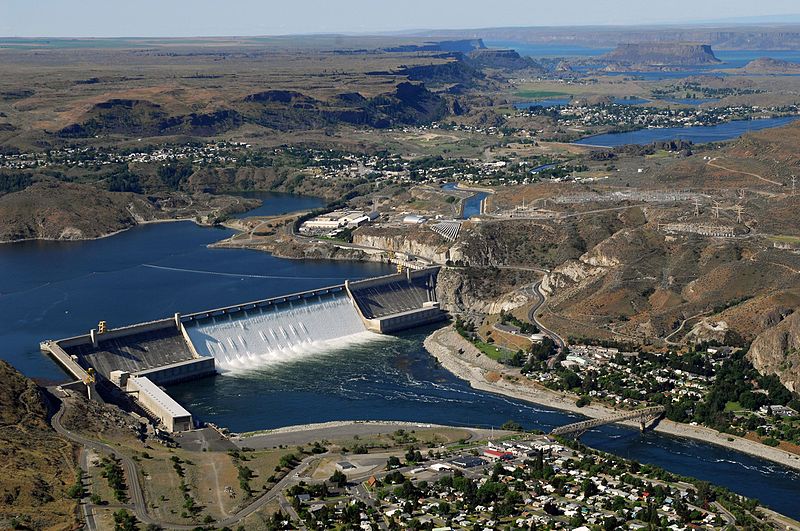
In 1945 America had the three highest dams in the world, the Hoover Dam, the Shasta Dam, and the Grand Couleee Dam.
              Height    Year     Power
               (m)    completed  (MW)

Niagara Adams           1895      37
Buffalo Bill    110     1910
Roosevelt       109     1911
Arrowrock       110     1915
Elephant Butte   92     1916
O'Shaughnessy   130     1923
Gorge            91     1924
Horse Mesa       93     1927      15
Canyon          109     1927      18
Pacoima         111     1929
Diablo          119     1930
Owyhee          127     1932
Hoover          221     1936     480
Grand Coulee    170     1942
Shasta          184     1945
Oroville Dam    187     1968     170
New Bullards    197     1969     150
Dworshak Dam    219     1973
 |
|
|---|---|
 |
 |
|
|---|---|---|
Tesla and Westinghouse built the first large-scale hydro-powered electricity plant at Niagara falls in 1895. It generated 37 megawatts of power and turbocharged American manufacturing.
 |
 |
|---|---|
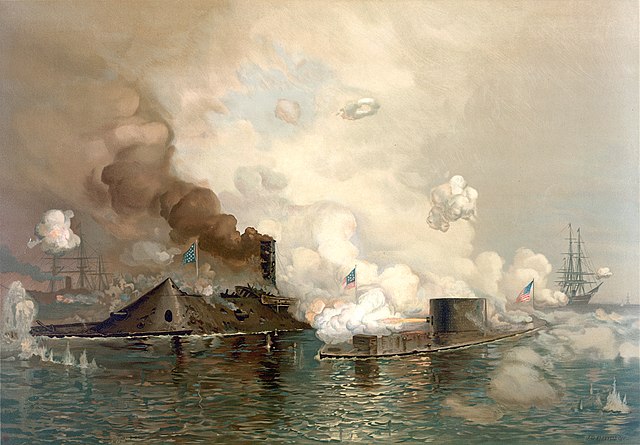
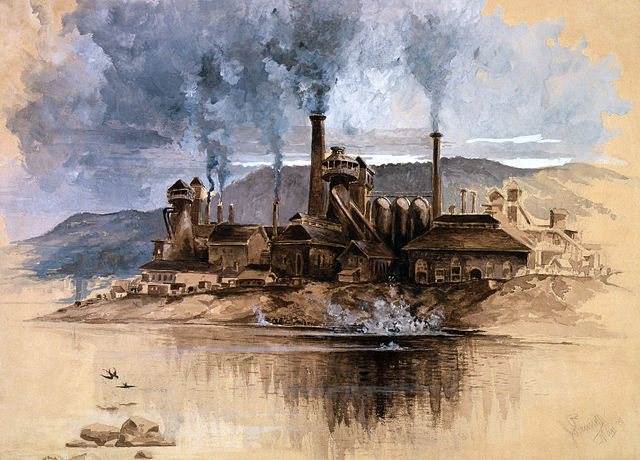
The first naval battle involving iron ships was in the civil war in 1862, between the North's Merrimac and the South's Virginia.
Steel production in 1913 in billion kg.
USA      31.5
Germany  19.3
UK       10.4
|
|---|
 |
 |
|---|---|
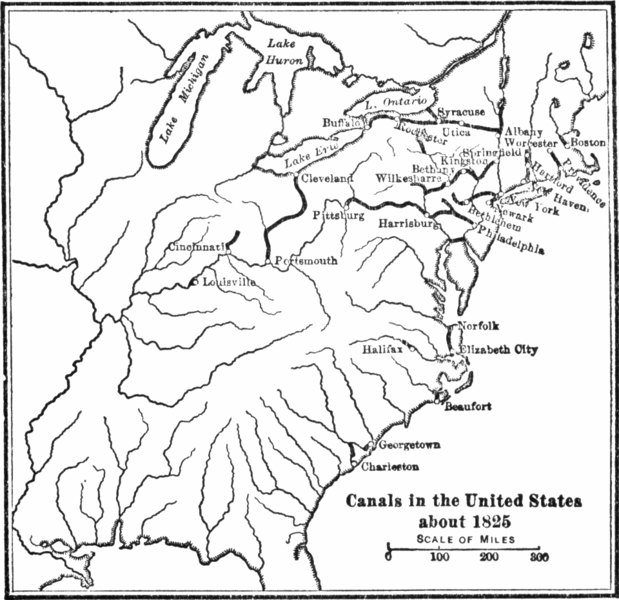
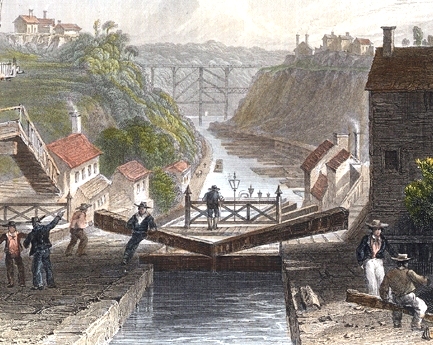
The Erie Canal, completed in 1825, was the second longest canal in the world.
Airports that are far from a major pro sports franchise include:
                     Million people   College   College
                        per year       size

Utah        Salt Lake C   12.8
Idaho       Boise          2.05       24100     Boise State
            Idaho Falls     .18
            Moscow                    10800     U Idaho
            Rexburg                   43000     BYU Idaho
            Pocatello                 10800     Idaho State
Montana     Bozeman         .78       15600     Montana State
            Billings        .46        4000     Montana State at Billings
            Missoula                   8300     University of Montana
            Butte                      2400     Montana Tech
N Dakota    Fargo           .47       14400     North Dakota State
            Bismarck        .31        4200     Bismarck State College
            Grand Forks               14200     U North Dakota
S Dakota    Sioux Falls     .57
            Rapid City      .34
Iowa        Des Moines     1.42
            Cedar Rapids    .67
Nebraska    Omaha          2.45
            Lincoln         .16
Kansas      Kansas City    5.75
            Wichita         .85
Oklahoma    Oklahoma City  2.13
            Tulsa          1.50
Alaska      Anchorage      2.65
            Fairbanks       .55
            Juneau          .36
Wyoming     Jackson Hole    .6
            Casper          .08
            Laramie                   12900      U Wyoming
         Million people/year

  1  Atlanta       53.5
  2  Los Angeles   42.9
  3  Chicago       40.9
  4  Dallas        35.8
  5  Denver        33.6
  6  New York JFK  31.0
  7  San Francisco 27.7
  8  Seattle       25.0
  9  Orlando       24.6
 10  Las Vegas     24.4
 11  Charlotte     24.2
 12  Newark        23.1
 13  Phoenix       22.4
 14  Houston       22.0
 15  Miami         21.3
 16  Boston        20.7
 23  Salt Lake C   12.8
 24  San Diego     12.6
 25  Wash Dulles   11.9
 26  Wash Reagan   11.6
 27  Tampa         10.9
 31  Nashville      8.92
 41  Kansas City    5.75
 43  Fort Myers     5.04
 52  Jacksonville   3.47
 53  W. Palm Beach  3.45
 57  Orlando        2.72
 58  Anchorage      2.65
 60  Omaha          2.45
 63  Memphis        2.31
 66  Oklahoma City  2.13
 67  Boise          2.05
 68  Louisville     2.04
 76  El Paso        1.74
 80  Tulsa          1.50
 83  Des Moines     1.42
101  Wichita         .85
108  Bozeman         .78
     Cedar Rapids    .67
     Sioux Falls     .57
     Fairbanks       .55
     Fargo           .47
     Billings        .46
     Juneau          .36
Data for 2019.
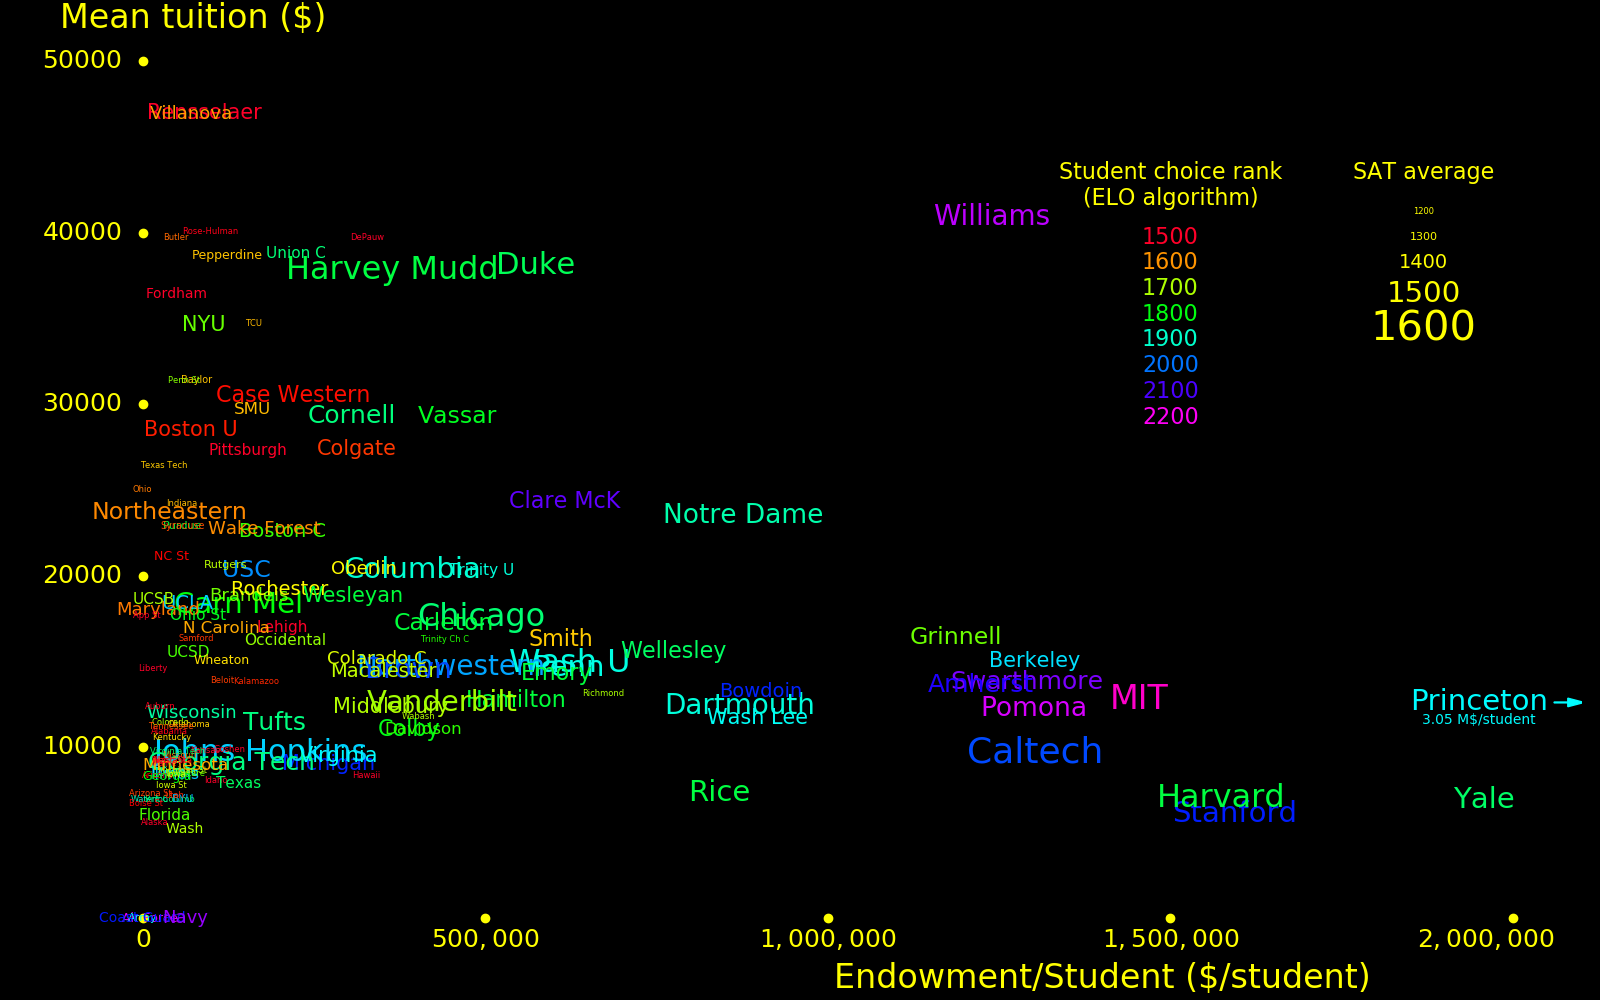
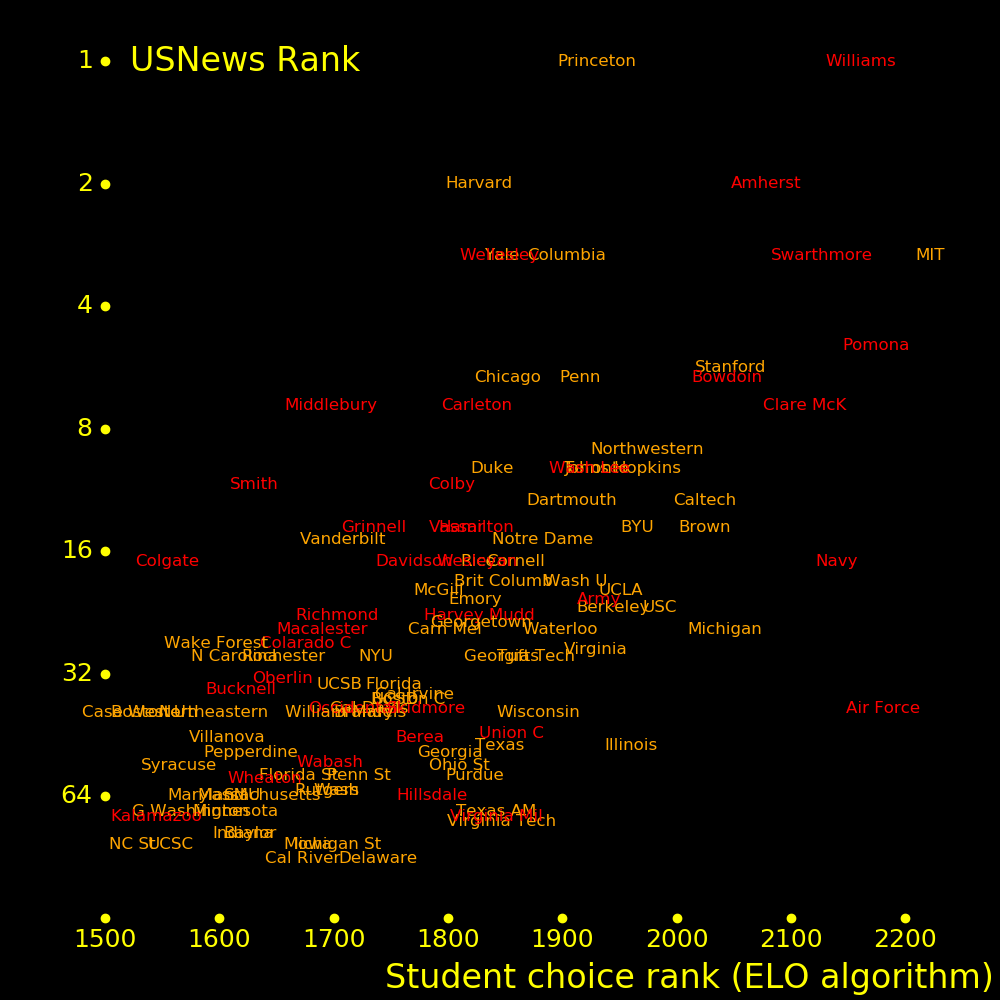
The measures of the strength of a college are:
Large endowment/student
Low average tuition
High student choice rank
High SAT average score
The plot shows these measures for American and Canadian colleges. Colleges that are in peril of failing are to the upper left, and are in small red font.
MIT is the most dominant college for student choice and SAT score. Student choice rankings come from parchment.com.
 |
|---|
The following plot shows the dominant STEM colleges.
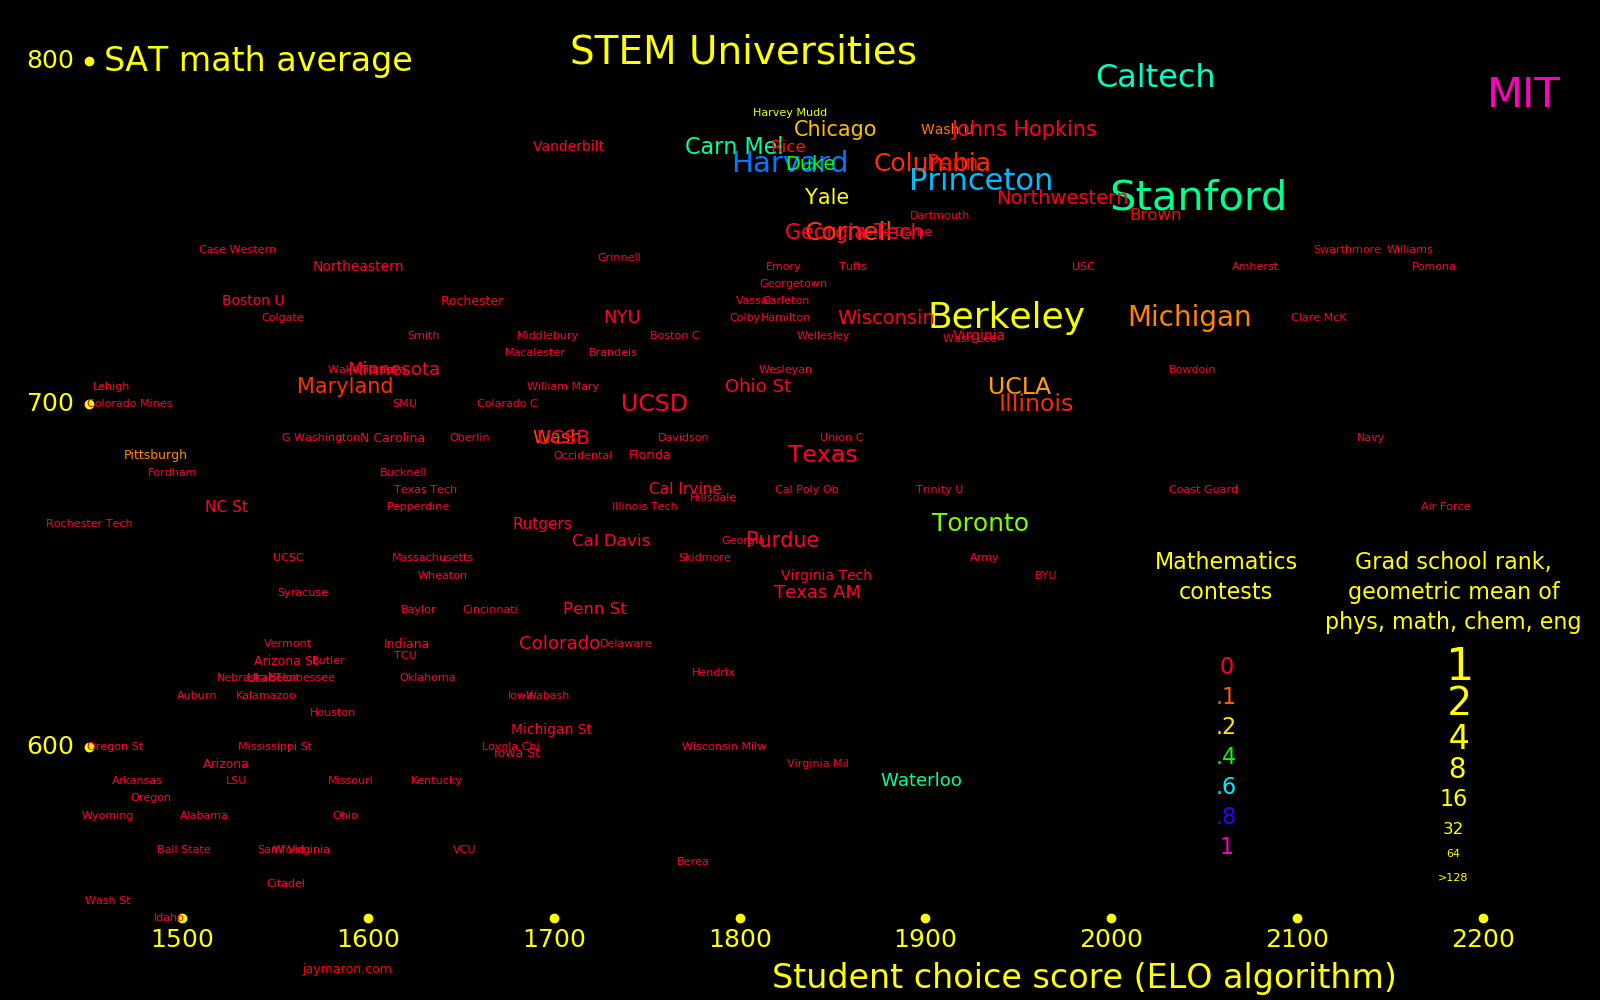 |
|---|
Student choice rankings are not well correlated with the USNews rankings.
 |
|---|
 |
|---|
 |
|---|
 |
|---|
 |
|---|